We have designed a Photoacoustic prototype system for in-vitro and ex-vivo imaging studies illustrated in Figure 1.
- The tissue is compressed in the sample holder.
- A short pulsed near infrared laser beam is delivered from the bottom of the sample holder via a fiber optic cable.
- The generated photoacoustic signals from the tissue enter the water filled photoacoustic camera through the acoustic window that also houses the acoustic lens and are detected by a 5MHz, 32 channel ultrasound linear array.
- A photoacoustic image is generated for each laser firing, the laser pulse repetition rate being 10 Hz.
- The photoacoustic camera is then raster scanned along with the fiber optic cable to image the entire tissue using stepper motors.
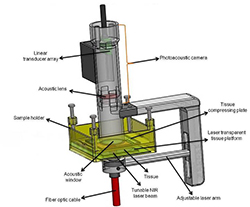
Figure 1. In-vitro/ex-vivo photoacoustic imaging probe
Results obtained using our in-vitro/ex-vivo photoacoustic imaging probe
Photoacoustic imaging of a lead pencil embedded inside a lamb kidney
The ex-vivo photoacoustic device was used to acquired 3D dataset of excised prostate tissue in transverse (B-scan) and coronal (C-scan) plane are reconstructed using custom-developed algorithms in Matlab programming language. Imaging was performed with the laser delivered onto the prostate using a trans-illumination setup as shown in Figure 1.
Using the above in-vitro prototype, we have demonstrated imaging a lamb kidney with 0.7 mm lead pencil inserted 1 cm deep inside. The lead pencil generates strong photoacoustic signal when irradiated with laser. Both the photoacoustic and the ultrasound images were acquired by scanning the tissue in with a 25 MHz ultrasound scanner and our 5 MHz photoacoustic imaging camera. Figure 2A shows the photograph of the lamb kidney with a lead pencil embedded into it. Figure 2B is the ultrasound image of the same coronal plane, figure 2C is the photoacoustic image of the coronal plane in which the lead pencil is embedded in the kidney and figure 2D is the fused/co-registered image of figures 2B and 2C showing the 0.7 mm lead pencil inside the kidney showing the anatomical features in the kidney along with the strong photoacoustic signal which is purely functional in nature (optical absorption of the lead pencil at 1064nm). The pencil thickness in the PA image is about 0.7 mm which corresponds to the resolution of the probe.
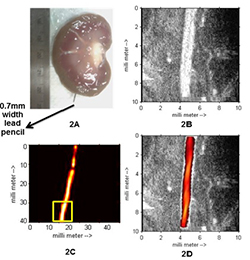
Figure 2. Photoacoustic Imaging of the lead pencil embedded within the Lamb kidney. 2A demonstrates a photograph of the lamb kidney with a lead pencil (arrow) embedded within it. 2B demonstrates Sonogram of the Lamb kidney with embedded lead pencil acquired with 25 MHz probe. 2C demonstrates photoacoustic image of lead pencil embedded within the lamb kidney using 5 MHz probe. 2D represents fusion image of ultrasound and photoacoustic of lead pencil.
Multispectral photoacoustic imaging of ex vivo prostate/thyroid/kidney tissue
The objective is to validate if ex-vivo multispectral photoacoustic imaging can differentiate between malignant tissue and normal tissue.
The surgically excised gland from each patient was immediately sent from the operating room to the surgical pathology. The excised gland was then inked and sectioned by a pathologist. The ex-vivo tissue sections were typically 2 – 5 millimeter (mm) thick and 20 – 40 mm wide. The ex-vivo sections with at least one grossly visible nodule were immediately placed in normal saline to prevent dryness, imaged with our multispectral photoacoustic imaging device and returned back to the surgical pathology within one hour post-surgery.
Laser intensity delivered onto the ex-vivo tissue was approximately 5 millijoules (mJ)/centimeter (cm)2, which is well below the maximum permissible energy limit (20 mJ/cm2 at 700 nm - 79.6 mJ/cm2 at 1000 nm) set by ANSI guidelines for safe human exposure. Photoacoustic imaging was performed at wavelengths of 760 nm, 850 nm, 930 nm and 970 nm that represent deoxyhemoglobin (dHb), oxyhemoglobin (HbO2), lipids and water respectively. The photoacoustic device was raster-scanned over the ex-vivo tissue to acquire a 3D photoacoustic dataset over a volume of 45 x 45 x 5 mm3. The whole process of procuring the surgically removed tissue, performing multispectral photoacoustic imaging and returning to the surgical pathology took approximately one hour. A significant change in the concentration of dHb in excised prostate tissue is not expected since it is bound deep within the tissue.
The photoacoustic image obtained at each wavelength is a composite map of optical absorption by all the tissue chromophores: dHb, HbO2, lipid and water. From the acquired multispectral photoacoustic images, individual chromophore photoacoustic images that represent optical absorption of dHb, HbO2, lipid and water were reconstructed using custom-developed algorithms in MATLAB® programming language.
For each excised tissue, areas corresponding to malignant and normal prostate were identified and marked on the histopathology slide by a pathologist as shown in Figure 3. The digital images of marked histopathology slides were obtained from the pathologist and co-registered with each of the four reconstructed chromophore photoacoustic C-scan images in order to be able to compare the marked regions.
In case of photoacoustic imaging of ex-vivo prostate, our preliminary results show that there is statistically significant difference in mean intensity of deoxyhemoglobin (p<0.0001) and lipid (p=0.0251) between malignant prostate and normal prostate tissue. There was difference in mean intensity of deoxyhemoglobin (p <.0001) between malignant prostate and benign prostatic hyperplasia. Sensitivity, specificity, positive predictive value and negative predictive value of our imaging system were found to be 81.3%, 96.2%, 92.9% and 89.3% respectively.
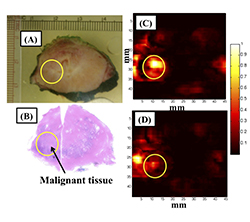
Figure 3: Multispectral photoacoustic imaging of ex-vivo prostate cancer: (A) Photograph of gross prostate specimen. (B) Histopathology of prostate with malignant region circled. (C) Photoacoustic imaging for deoxyhemoglobin. (D) Photoacoustic imaging for oxyhemoglobin. Higher absorption of deoxyhemoglobin was seen in the region of interest corresponding to malignant prostate tissue compared to oxyhemoglobin.