Poster Day Awards
Poster Day Awards
28th Annual Resident Poster Day Presentation
October 7, 2025
Resident Poster Day is an annual event for any Medicine or Med/Peds residents to present clinical cases, QI projects, research or educational innovations. The event is open to the three city programs. This year, posters were presented in the Clinical Vignette, Research, and QI categories. Posters were judged on the chosen topic, the poster arrangement and the oral presentation.
Click on an image below to view slide gallery.
Winners of Poster Day 2025
Clinical Vignette
Diamond Guy, M.D.1; Alexandra Bender, M.D., Ph.D.2; Kathleen Mannava, M.D.3,4; and Alison Moynihan, M.D., Ph.D.4
1Department of Internal Medicine, University of Rochester Medical Center; 2Victor Dermatology, Rochester, NY; 3Department of Pathology, University of Rochester Medical Center; 4Department of Dermatology, University of Rochester Medical Center
Background
Poison ivy (Toxicodendron radicans) is a common cause of allergic contact dermatitis, a delayed (type IV) hypersensitivity reaction triggered by re-exposure to a sensitizing agent [1]. Exposure results in a papulovesicular rash with erythema, pruritus, and edema. [2] Given the inflammatory etiology of allergic contact dermatitis, antimicrobials and hydrogen peroxide are not indicated. Furthermore, (triple antibiotic ointment (TAO)) is a well-documented cause of allergic contact dermatitis, primarily due to neomycin and bacitracin—two of the top 15 allergens responsible for such reactions. [3,4] In this case, chronic TAO use was likely worsened by concurrent use of hydrogen peroxide. At high doses, hydrogen peroxide can induce oxidative stress and result in blistering, desquamation, erythema, pigmentary changes, and epidermal necrosis. [5] The mainstay treatments for poison ivy-induced contact dermatitis are moderate- to high-potency topical or systemic corticosteroids, most beneficial early in the disease (before the appearance of papules or vesicles). [6]
Here, we present a case of chronic allergic contact dermatitis due to chronic use of TAO and hydrogen peroxide that significantly improved upon termination and proper wound care. In our case, the patient’s rash resolved rapidly after discontinuing the TAO and hydrogen peroxide, supporting the diagnosis without the need for patch testing. Diagnosis is often clinical, and resolution after avoidance confirms the causative agent. Patch testing remains a useful tool when the allergen is unclear or symptoms persist despite avoidance [1].
Case Presentation
A man in his 60s with a medical history significant for hypertension and sulfa drug allergy was admitted to the hospital for acute kidney injury and encephalopathy. The inpatient providers noted a rash on the right lower extremity (RLE) and dermatology was consulted due to concern for malignancy. Upon resolution of the patient’s encephalopathy, history from the patient revealed poison ivy exposure to the RLE while lawn mowing four years prior. At that time, the patient’s general practitioner recommended cleansing the area with mild soap and water followed by hydrogen peroxide, then neomycin/polymyxin B/bacitracin (TAO). Our patient continued this regimen for four years, until Dermatology was consulted.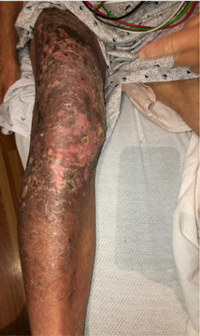
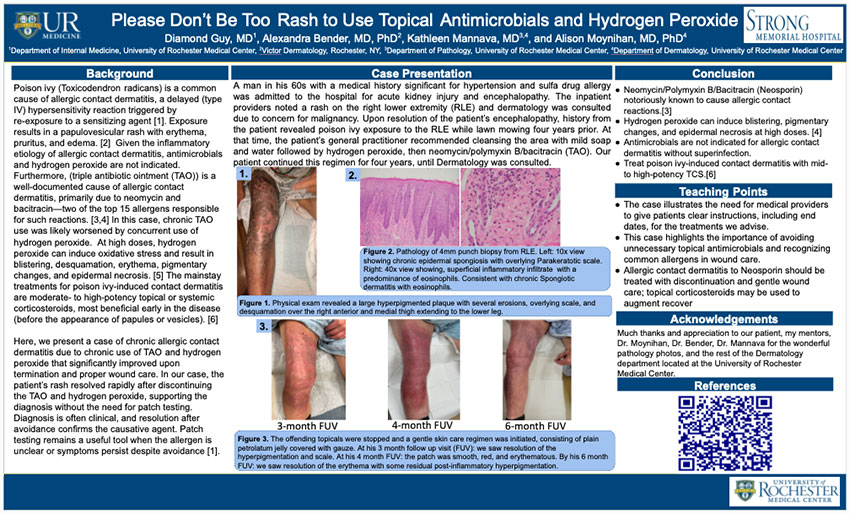
Figure 1. Physical exam revealed a large hyperpigmented plaque with several erosions, overlying scale, and desquamation over the right anterior and medial thigh extending to the lower leg.

Figure 2. Pathology of 4mm punch biopsy from RLE. Left: 10x view showing chronic epidermal spongiosis with overlying Parakeratotic scale. Right: 40x view showing, superficial inflammatory infiltrate with a predominance of eosinophils. Consistent with chronic Spongiotic dermatitis with eosinophils.
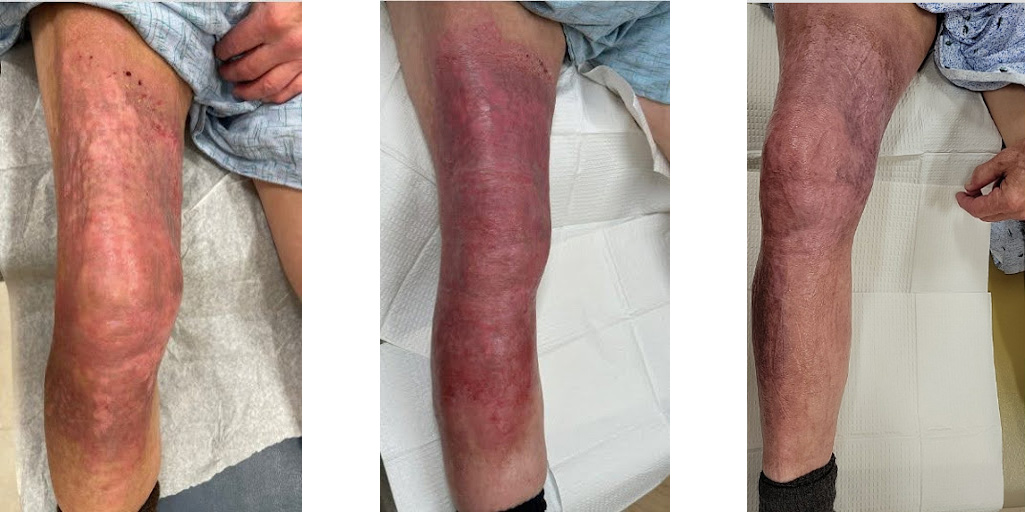
Figure 3. The offending topicals were stopped and a gentle skin care regimen was initiated, consisting of plain petrolatum jelly covered with gauze. At his 3 month follow up visit (FUV): we saw resolution of the hyperpigmentation and scale. At his 4 month FUV: the patch was smooth, red, and erythematous. By his 6 month FUV: we saw resolution of the erythema with some residual post-inflammatory hyperpigmentation.
Conclusion
- Neomycin/Polymyxin B/Bacitracin (Neosporin) notoriously known to cause allergic contact reactions.[3]
- Hydrogen peroxide can induce blistering, pigmentary changes, and epidermal necrosis at high doses. [4]
- Antimicrobials are not indicated for allergic contact dermatitis without superinfection.
- Treat poison ivy-induced contact dermatitis with mid- to high-potency TCS.[6]
Teaching Points
- The case illustrates the need for medical providers to give patients clear instructions, including end dates, for the treatments we advise.
- This case highlights the importance of avoiding unnecessary topical antimicrobials and recognizing common allergens in wound care.
- Allergic contact dermatitis to Neosporin should be treated with discontinuation and gentle wound care; topical corticosteroids may be used to augment recover.
Acknowledgements
Much thanks and appreciation to our patient, my mentors, Dr. Moynihan, Dr. Bender, Dr. Mannava for the wonderful pathology photos, and the rest of the Dermatology department located at the University of Rochester Medical Center.
Avi Prajapati, M.D.; Kingshuk Mazumdar, M.D., M.B.A.
Department of Medicine, University of Rochester Medical Center
Introduction
Acquired methemoglobinemia is a disorder caused by exposure to an oxidant stressor resulting in formation of elevated levels of methemoglobin, a form of hemoglobin with poor oxygen-binding capacity. (Figure 1)
Pathophysiology:

Figure 1. Pathophysiology of methemoglobin formation. Iron in heme groups is oxidized from ferrous (Fe2+) state to ferric (Fe3+) state, impairing its oxygen-binding capacity and resulting in a functional anemia
Common Oxidants:
- Local anesthetics, antibiotics, antineoplastics
- Various nitrites and nitrates found in contaminated food and water
- Pharmaceuticals and recreational drugs
Case Presentation
A 23-year-old female with history of anxiety, depression, and suicidal ideation presented to the emergency department after being found unconscious at home by EMS, surrounded by bottles of bupropion and hydroxyzine.
Vitals
T 34.9oC, BP 84/52, HR 130, RR 27, SpO2 88% on 15L HFNC
Physical Exam
Cardiovascular: tachycardia, 1+ radial and dorsalis pedis pulses
Neuro: Unresponsive; GCS Eye 2, Verbal 1, Motor 4
Skin: diffusely cyanotic
She underwent intubation, though hypoxia was refractory to maximal oxygen supplementation.
Blood drawn was noted to appear “dark chocolate” in color. (Figure 2)

Figure 2. Reference image--Chocolate colored blood
Hospital Course
Labs: Methemoglobin level of 57%.
Toxicology was consulted and the patient received three doses of methylene blue (MB), activated charcoal, and orogastric lavage.
Oxygenation improved over the course of one hour, and, after the third dose of MB, her SpO2 reached > 95%. Her cyanosis gradually resolved along with improvements in oxygenation.
Following extubation, the patient disclosed ingesting sodium nitrite shortly before EMS arrival.
Key Points
Maintain high index of suspicion for acquired methemoglobinemia in patients presenting with cyanosis and hypoxemia unresponsive to supplemental oxygen.
- Supportive findings include chocolate-colored blood and a characteristic saturation gap between pulse oximetry (SpO2) and arterial blood gas (SaO2) measurements.
- Severe cases may progress to central nervous system depression, cardiovascular collapse, and death.
First-line therapy = intravenous MB at 1 mg/kg for severe methemoglobinemia (level > 30%) up to total 7mg/kg. (Figure 3) Simultaneous Hematology consult if unresponsive to MB for consideration of exchange transfusion.
Increasing incidence of acquired methemoglobinemia has been linked to intentional sodium nitrite ingestion in the form of a “suicide kit”.
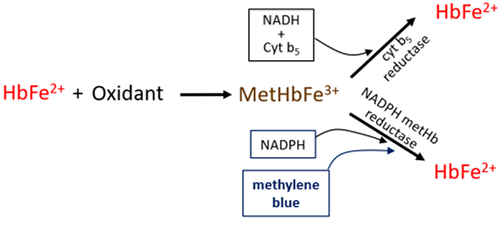
Figure 3. Methylene Blue (MB) Mechanism-of-Action MB serves as an electron carrier intermediate to allow NADPH metHb reductase, a normally inactive enzyme, to reduce MetHbFe3+.
References
- 2023 American Heart Association Focused Update on the Management of Patients With Cardiac Arrest or Life-Threatening Toxicity Due to Poisoning: An Update to the American Heart Association Guidelines for Cardiopulmonary Resuscitation and Emergency Cardiovascular Care. Lavonas EJ, Akpunonu PD, Arens AM, et al. Circulation. 2023;148(16):e149-e184. doi:10.1161/CIR.0000000000001161.
- PROVAYBLUE. Food and Drug Administration. Updated date: 2025-05-28.
- An Atypical Case of Methemoglobinemia due to Self-Administered Benzocaine. Nappe TM, Pacelli AM, Katz K. Case Rep Emerg Med. 2015;2015:670979. doi: 10.1155/2015/670979. Epub 2015 Mar 19. PMID: 25874137; PMCID: PMC4383305.
- Tox and Hound – Fellow Friday – Methylene Blue Infusions. (2018, June 22). Written by Steve Curry. Tox & Hound. https://toxandhound.com/toxhound/refractory-methemoglobinemia
- Co-Occurrence of Acute Hemolytic Anemia and Methemoglobinemia in a 74-Year-Old Female With G6PD Deficiency: A Case Report. Chen B, Han Y. Medicine. 2025;104(24):e42826. doi:10.1097/MD.0000000000042826.
- Review and Drug Therapy Implications of Glucose-6-Phosphate Dehydrogenase Deficiency. Belfield KD, Tichy EM. American Journal of Health-System Pharmacy : AJHP : Official Journal of the American Society of Health-System Pharmacists. 2018;75(3):97-104. doi:10.2146/ajhp160961.
- Drug-Induced Methaemoglobinaemia. Treatment Issues. Coleman MD, Coleman NA. Drug Safety. 1996;14(6):394-405. doi:10.2165/00002018-199614060-00005.
- Methemoglobinemia in the Operating Room and Intensive Care Unit: Early Recognition, Pathophysiology, and Management. Cefalu JN, Joshi TV, Spalitta MJ, et al. Advances in Therapy. 2020;37(5):1714-1723. doi:10.1007/s12325-020-01282-5.
- Therapeutic Whole Blood Exchange in the Management of Methaemoglobinemia: Case Series and Systematic Review of Literature. Singh P, Rakesh K, Agarwal R, et al. Transfusion Medicine (Oxford, England). 2020;30(3):231-239. doi:10.1111/tme.12666.
- Severe Methemoglobinemia and Death From Intentional Sodium Nitrite Ingestions. Mudan A, Repplinger D, Lebin J, et al. The Journal of Emergency Medicine. 2020;59(3):e85-e88. doi:10.1016/j.jemermed.2020.06.031.
- Two Cases of Fatal Methemoglobinemia Caused by Self-Poisoning With Sodium Nitrite: A Case Report. Mun SH, Park GJ, Lee JH, et al. Medicine. 2022;101(7):e28810. doi:10.1097/MD.0000000000028810.
Mohamed Elhennawi, MD1, Nouran Elhenawy, MD¹, Ahmed Ghorab, MD2
1Department of Internal Medicine, Unity Hospital – Rochester Regional Health; 2Department of Internal Medicine, Royal Blackburn Teaching Hospital, Blackburn, UK
Introduction
Necrotizing pancreatitis is a severe complication of acute pancreatitis, usually confined to the retroperitoneum. Extension into the thoracic cavity, particularly the posterior mediastinum, is extremely rare and can present with chest pain, mimicking cardiopulmonary disease.
Clinical Presentation
A 28-year-old female with a history of hiatal hernia and biliary colic presented with central abdominal pain. Initial labs showed lipase 25 U/L, amylase 27 U/L, CRP 17.9 mg/dL, WBC 20 x10³/μL, total bilirubin 0.53 mg/dL, and calcium 10.0 mg/dL. Abdominal ultrasound revealed a 4 mm gallstone.
Overnight, she developed acute retrosternal chest pain described as "behind my heart," pleuritic in nature, 7/10 intensity, and associated with nausea and vomiting. ECG showed sinus tachycardia with QT prolongation but no ischemia. CT chest ruled out pulmonary embolism but showed a 5.4 cm fluid collection in the posterior mediastinum.
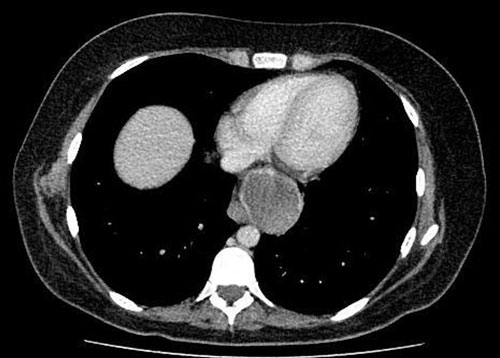
Image 1: CT Chest demonstrating 5.4 cm collection into posterior mediastinum
Further CT of the abdomen and pelvis revealed multiple walled-off pancreatic necrosis, the largest measuring 15.7 cm, with clear posterior mediastinal extension.
Image 2: CTAP : multiple walled off necrosis, Largest 15.7 cm
She was managed with intravenous antibiotics and subsequently underwent endoscopic ultrasound (EUS)-guided drainage using a lumen-apposing AXIOS stent. Repeat CTAP in 8 weeks ( image 3,4).displayed complete resolution of the mediastinal collection, and replacement b hiatal hernia (initially compressed by the collection). She later underwent interval laparoscopic cholecystectomy and was discharged in stable condition.
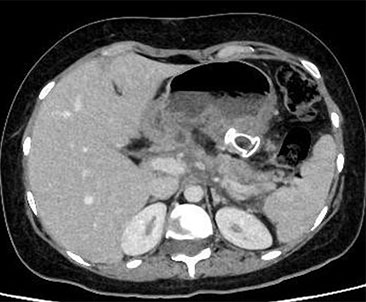
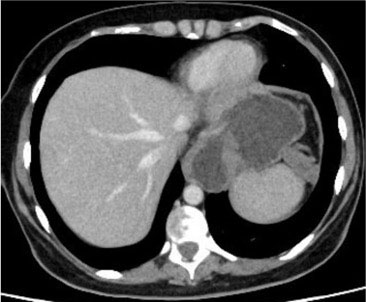
Image 3, 4: CTAP demonstrating “AXIOS” stent in situ, resolution of Mediastinal Collection Replacement by Hiatal hernia
Discussion
Posterior mediastinal extensions of necrotizing pancreatitis are rare and may present with misleading symptoms often triggering cardiac or pulmonary evaluations.
Hiatal hernias, especially Type IV (5–15% of cases), can provide a pathway for pancreatic enzymes, necrotic tissue, or pseudocysts to migrate through the widened hiatus under negative intrathoracic pressure serving as conduits.
Management is individualized but increasingly favors minimally invasive techniques. EUS-guided drainage with LAMS (e.g., AXIOS) has shown success even in complex extra-abdominal collections. This case highlights the importance of recognizing pancreatitis as a potential cause of chest pain in patients with hiatal hernia and supports the expanding role of EUS-guided therapy.
References
- V. Chansomphou et al.Pancreatic pseudocyst with mediastinal extension: a rare complication of acute or chronic pancreatitis. PMCID: PMC8436270.PMC
- U. Sadat, A. Jah & E. Huguet. Mediastinal extension of a complicated pancreatic pseudocyst: a case report and literature review.Journal of Medical Case Reports, 2007. BioMed Central
- A. Al-Taee et al.A Symptomatic Posterior Mediastinal Space Pseudocyst Managed by Cystgastrostomy Through a Hiatal Hernia. The American Journal of Gastroenterology (2021).
Research
Charlotte Blumrosen, MD1; Claire Clark2; Mila Strawderman, MS3; Jennifer Magire, MD4; Robert J. Fortuna, MD, MPH1,2
1Departments of Medicine and Pediatrics; 2University of Rochester; 3Department of Biostatistics and Computational Biology; 4Department of Family Medicine
University of Rochester Medical Center
Introduction
- Colorectal cancer (CRC) → 2nd leading cause of mortality in the US and worldwide.
- The USPSTF recommends screening for CRC in patients 45-75 years.
- Black patients experience lower screening rates, higher CRC incidence, and increased mortality compared to White patients. Lower SES also influences screening rates.
- However, the intersecting impact of race and social vulnerability on colorectal cancer screening is not well defined.
Objective
Investigate the intersecting influence of race and social vulnerability on colorectal cancer screening
Methods
We examined EMR data for 117,424 patients eligible for colorectal cancer screening in Western New York.
Eligible patients included adults aged 45-75 years.
Screening modalities include a colonoscopy every 10 years, fecal immunochemical test every year, or stool DNA test every 3 years.
Social Vulnerability Index (SVI) is a comprehensive scoring system that ranges from 0-100 and incorporates various elements of SDoH at a population level. Higher scores indicate greater social vulnerability.
We used log-binomial multivariable regression models to examine the influence of race and social vulnerability on colorectal cancer screening. Models were adjusted for age, sex, marital status, community type, and interaction between race and SVI.
Results
Table 1. Patient Characteristics and Rates of Screening
| Sample N (%) | Screened (Rate) | |
|---|---|---|
| Total Sample | 117,424 | 88,276 (75.2) |
| Race: Black | 10,455 (8.9) | 6,732 (64.4) |
| Race: White | 106,969 (91.1) | 81,544 (76.2) |
| Overall SVI Score Mean (SD) | ||
| 0-24 | 45,102 (38.4) | 35,689 (79.1) |
| 25-49 | 38,982 (33.2) | 29,469 (75.6) |
| 50-74 | 22,442 (19.1) | 16,206 (72.2) |
| 75-100 | 10,898 (9.3) | 6,912 (63.4) |
| Age | ||
| mean (SD) | 60.4 (8.4) | 61.6 (7.9) |
| 41-50 | 18,084 (15.4) | 9,224 (51.0) |
| 51-60 | 39,378 (33.5) | 29,498 (74.9) |
| 61-70 | 43,693 (37.2) | 35,823 (82.0) |
| 71-80 | 16,269 (13.9) | 13,731 (84.4) |
Figure 1. Percent of Eligible Patients Screened by Race and Social Vulnerability Index

Figure 1. Colorectal cancer screening rates declined with increasing social vulnerability among both Black and White patients. Across all social vulnerability groups, Black patients were consistently less likely to be screened than White patients.
Table 2. Log-Binomial Regression Predicting CRC Screening with Interaction of Race and Overall SVI
| Effect | RR Estimate | 95% Confidence Limits | P-value/th> |
|---|---|---|---|
| SVI (25-49 vs 0-24=least vulnerable) | 0.971 | 0.964 - 0.977 | <0.0001 |
| SVI (50-74 vs 0-24) | 0.955 | 0.946 - 0.964 | <0.0001 |
| SVI (75-100 vs 0-24) | 0.881 | 0.865 - 0.897 | <0.0001 |
| Race (Black vs White) | 0.981 | 0.952 - 1.011 | 0.201 |
| Hispanic (yes vs non-Hispanic) | 0.962 | 0.936 - 0.988 | 0.005 |
| Hispanic (unspecified vs non-Hispanic) | 0.914 | 0.895 - 0.934 | <0.0001 |
| Sex (Male vs Female) | 0.993 | 0.987 - 0.998 | 0.012 |
| Marital Status (Single vs Married) | 0.878 | 0.869 - 0.886 | <0.0001 |
| Marital Status (Divorced vs Married) | 0.936 | 0.927 - 0.946 | <0.0001 |
| Marital Status (Widowed vs Married) | 0.947 | 0.933 - 0.961 | <0.0001 |
| Marital Status (Unspecified vs Married) | 0.794 | 0.750 - 0.840 | <0.0001 |
| Community (Micro vs Metro) | 0.937 | 0.921 - 0.953 | <0.0001 |
| Community (Town vs Metro) | 0.939 | 0.924 - 0.955 | <0.0001 |
| Community (Rural vs Metro) | 0.944 | 0.925 - 0.964 | <0.0001 |
| Age (41-50 vs 61-70) | 0.632 | 0.623 - 0.642 | <0.0001 |
| Age (51-60 vs 61-70) | 0.924 | 0.917 - 0.930 | <0.0001 |
| Age (71-80 vs 61-70) | 1.026 | 1.019 - 1.034 | <0.0001 |
| Black & SVI=25-49 (yes vs no) | 0.979 | 0.941 - 1.020 | 0.310 |
| Black & SVI=50-74 (yes vs no) | 0.934 | 0.894 - 0.975 | 0.002 |
| Black & SVI=75-100 (yes vs no) | 0.981 | 0.942 - 1.021 | 0.345 |
Table 3. Adjusted Risk Ratio of CRC Screening for Black Patients vs. white Patients by SVI
| SVI Category | Black vs White Rate Ratio (RR) Estimate | 95% Confidence Limits | P-Value |
|---|---|---|---|
| 0 – 24 | 0.981 | 0.952 - 1.011 | 0.201 |
| 25 – 49 | 0.960 | 0.935 - 0.987 | 0.003 |
| 50 – 74 | 0.916 | 0.887 - 0.945 | <0.0001 |
| 75 – 100 | 0.962 | 0.936 - 0.988 | 0.005 |
Conclusions
- Screening rates decreased with increasing social vulnerability.
- Among patients living in the most socially vulnerable census tracts, Black patients were significantly less likely to be screened for colorectal cancer than
- White patients facing similar social vulnerability. Within the least socially vulnerable group (most affluent), there was no statistical difference in the rate of CRC screening by race.

Jie Yin, M.D.1; Marielle Jensen-Battaglia, P.T.2, D.P.T., Ph.D.; Amesha Narpaul1; Soroush Mortaz-Hedjri, M.D.1; Erika Ramsdale, M.D.1; Mostafa Mohamed, M.B.B.Ch., Ph.D.1; Jason Mendler, M.D., Ph.D.1; Jane Liesveld, M.D.1; Rachel Rodenbach, M.D.1; Eric Huselton, M.D.1; Craig Maguire, M.D.1; Bassil Said, M.D.1; Ilana Massi1; Julie Moser, Ed.D.1; Supriya Mohile, M.D.1; Kah Poh Loh, M.D.1
1Wilmot Cancer Center, Strong Memorial Hospital, University of Rochester, Rochester, NY; 2Department of Internal Medicine, Yale School of Medicine, New Haven, CT
Introduction
Polypharmacy
- Regular use of ≥ 5 medications
- Common in older adults
- Linked to worse outcomes, including in AML
How polypharmacy is discussed during upfront treatment decisions remains unclear. A greater understanding could inform strategies for medication optimization.
Aims
- To examine polypharmacy discussions in initial treatment visits with older adults newly diagnosed with AML
- To evaluate how these concerns were addressed in a pilot randomized controlled trial of a geriatric assessment and value-based decisional intervention (UR-GOAL)
Methods
53 patients aged ≥ 60 years old at the Wilmot Cancer Institute with newly diagnosed AML.
- 27 Patients were randomized to UR-GOAL. Oncologists received a report prior to the visit that included:
- presence of polypharmacy
- patient values, fitness, and preferences for prognostic information.
- 26 patients were randomized to usual care.
For all patients, Treatment decision-making encounters were audio-recorded and transcribed. Polypharmacy concerns and oncologist responses coded independently by three coders using a standardized manual with responses categorized as addressed, acknowledged, or dismissed.
Results
Table 1. Characteristics of Total Study Population
| Characteristic | Total Study Population (n=53) |
|---|---|
| Median age at time of study | 74 |
| % Female | 30 |
| % White | 91 |
| % Polypharmacy (regular use of ≥ medications) | 43 |
| Total polypharmacy concerns | 39 |
Figure 1. Who Initiated Conversation
Percentage of conversations initiated by oncologists, patients and caregivers.
Figure 2. Oncologist Response Quality
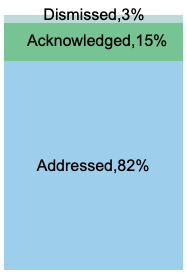
Percentage of conversations addressed, acknowledged or dismissed.
Figure 3. Frequency of Polypharmacy Concerns by Categories
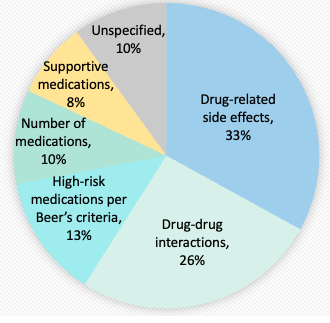
Table 2. Polypharmacy Concerns by Common Themes
| Common Polypharmacy Themes (n=37) | # of Concerns |
|---|---|
| Interaction of vitamins, herbs, cannabis, and probiotics with chemotherapy | 8 |
| Side effects of home medications | 7 |
| Bleeding risk from antiplatelet or anticoagulation while on chemotherapy | 6 |
| Side effects of prophylactic antimicrobials | 5 |
| Adjustment of home medications | 4 |
| Ability to manage multiple home medications | 4 |
| Interaction of prophylactic anti-fungal and antibiotics with chemotherapy | 3 |
Note: 2 concerns are nonspecific and are not included in the table.
Figure 4. Frequency of Common Oncologist Interventions by Categories (% of total concerns)
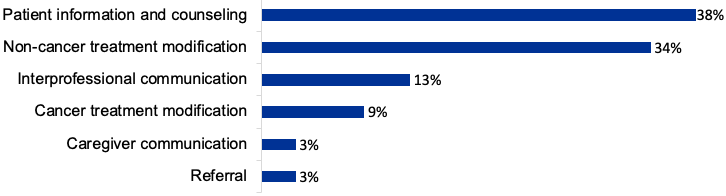
Table 3. Percentage of polypharmacy at baseline in usual care vs. UR-GOAL, followed by average number of polypharmacy concerns per patient in each group. Hypothesis test for difference by study arm not completed as this is an exploratory analysis with small sample size.
Conclusions
- Common polypharmacy concerns during treatment decision-making
- drug-related side effects
- drug–drug interactions
- high-risk medications
- Future interventions could be designed to address these common concerns
Acknowledgements
We would like to thank our patients for their participation in the study and the oncologists at Wilmot Cancer Institute for their help with patient enrollment. We also thank the American Cancer Society and Conquer Cancer Foundation Walther Cancer Foundation for funding the study.
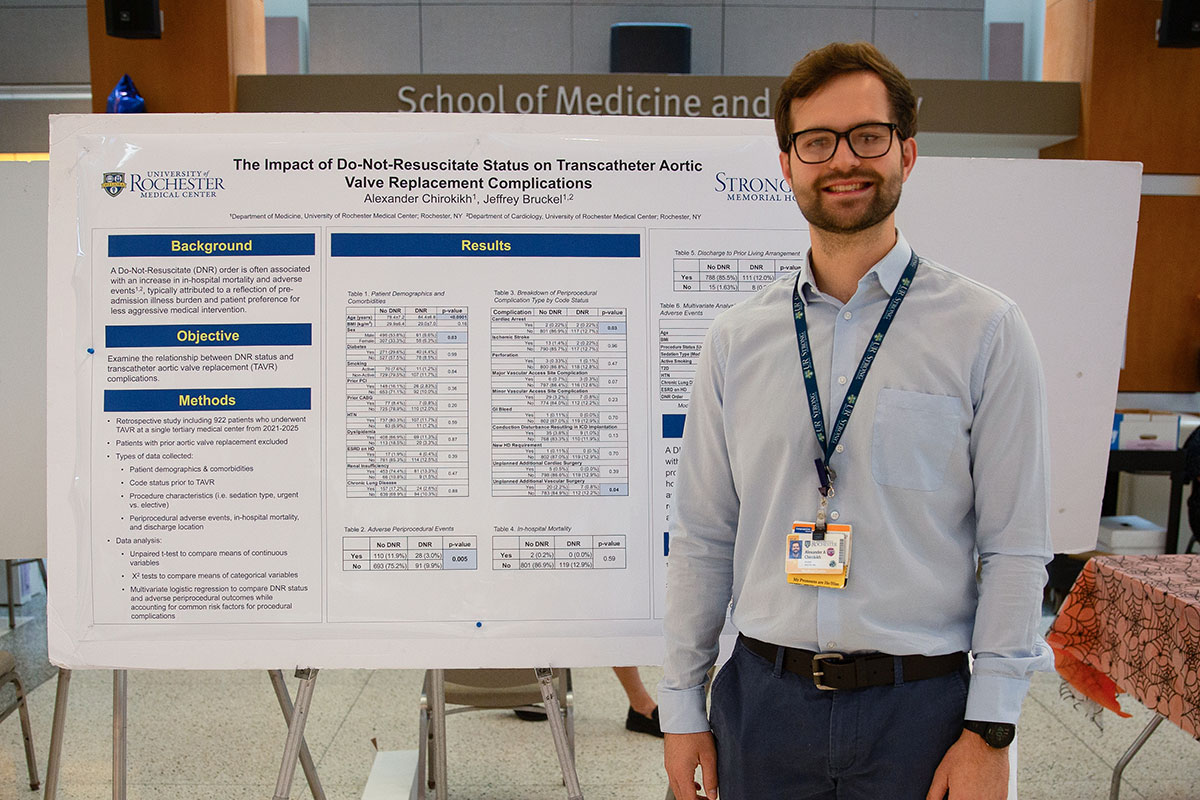
Alexander Chirokikh, M.D.;1 Jeffrey Bruckel, M.D., M.P.H.2
Background
A Do-Not-Resuscitate (DNR) order is often associated with an increase in in-hospital mortality and adverse events,1,2 typically attributed to a reflection of pre-admission illness burden and patient preference for less aggressive medical intervention.
Objective
Examine the relationship between DNR status and transcatheter aortic valve replacement (TAVR) complications.
Methods
- Retrospective study including 922 patients who underwent TAVR at a single tertiary medical center from 2021-2025
- Patients with prior aortic valve replacement excluded
- Types of data collected:
- Patient demographics & comorbidities
- Code status prior to TAVR
- Procedure characteristics (i.e. sedation type, urgent vs. elective)
- Periprocedural adverse events, in-hospital mortality, and discharge location
- Data analysis:
- Unpaired t-test to compare means of continuous variables
- Χ2 tests to compare means of categorical variables
- Multivariate logistic regression to compare DNR status and adverse periprocedural outcomes while accounting for common risk factors for procedural complications
Results
Table 1. Patient Demographics and Comorbidities
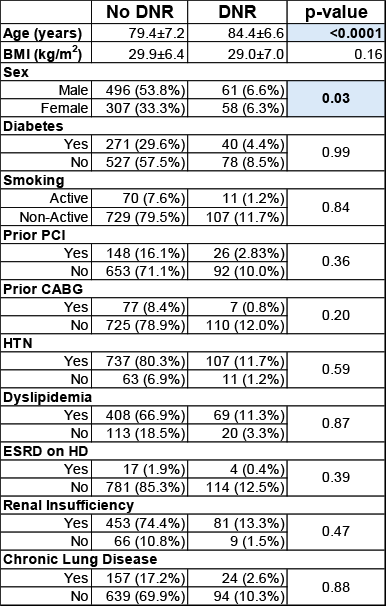
Table 2. Adverse Periprocedural Events

Table 3. Breakdown of Periprocedural Complication Type by Code Status
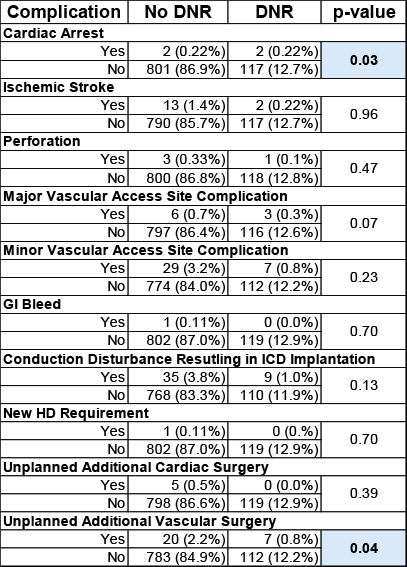
Table 4. In-hospital Mortality
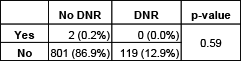
Table 5. Discharge to Prior Living Arrangement

Table 6. Multivariate Analysis Predicting Periprocedural Adverse Events

Model Summary Χ2=26.1, p=0.004, R2=0.035, dF=10
Conclusions
A DNR order prior to TAVR is associated with a higher likelihood of intra and post-procedure adverse events, but not in-hospital mortality. Having a DNR order is associated with a lower probability of return to prior living arrangement directly after admission for TAVR.
References
- Brovman et al. Postoperative outcomes in patients with a do-not-resuscitate (DNR) order undergoing elective procedures. J Clin Anesth. 2018 Aug;48:81-88.
- Wenger et al. Outcomes of patients with do-not-resuscitate orders. Toward an understanding of what do-not-resuscitate orders mean and how they affect patients. Arch Intern Med. 1995 Oct 23;155(19):2063-

QI
M. Shah, A. Donofrio, Han H, Noor F, Hazen K1, Gleber C, Zhang Y. V, Harbuz-Miller I
Department of Medicine, University of Rochester Medical Center, Rochester, New York, USA
Background
- The total cortisol assay is used to diagnose adrenal insufficiency.
- Holding glucocorticoids for 24 hours prior to measuring cortisol is recommended.
- Testing cortisol while on glucocorticoid leads to inaccurate results due to assay interference.
Objective
- Evaluate inappropriate testing of cortisol in hospitalized patients in an academic center.
- Improve adrenal insufficiency diagnosis by implementing guidelines for inpatient providers.
- Reduce inappropriate testing of total cortisol in hospitalized patients by half within six months.
Methods
- Slicer Dicer tool (Epic) identified patients tested with total cortisol assay during March 1-31, 2024, at our academic medical center and affiliated hospitals.
- Primary data: value of cortisol and time it was collected as well as the name, dosage, and administration time of any glucocorticoid given within 24 hours of assay collection.
- Secondary data: number of patients with abnormal cortisol lost to follow up (defined as no documentation interpreting the random cortisol < 10 ug/dL the following day or acting on result).
- A clinical decision support was added to the total cortisol order set on March 12, 2025, as an intervention.
- After the intervention, we identified the number of patients tested with total cortisol assay between May 1-May 31, 2025, to assess change in primary and secondary outcomes.
Intervention
- The intervention aims to educate inpatient providers on optimal blood cortisol testing.
- Clinical decision support was added within the order set of total cortisol in the electronic medical record to reinforce ordering best practices.
- The order reflects the last 24 hours glucocorticoid received by the patient.

Results
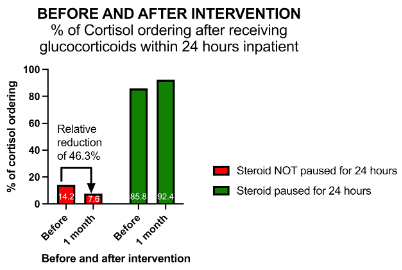
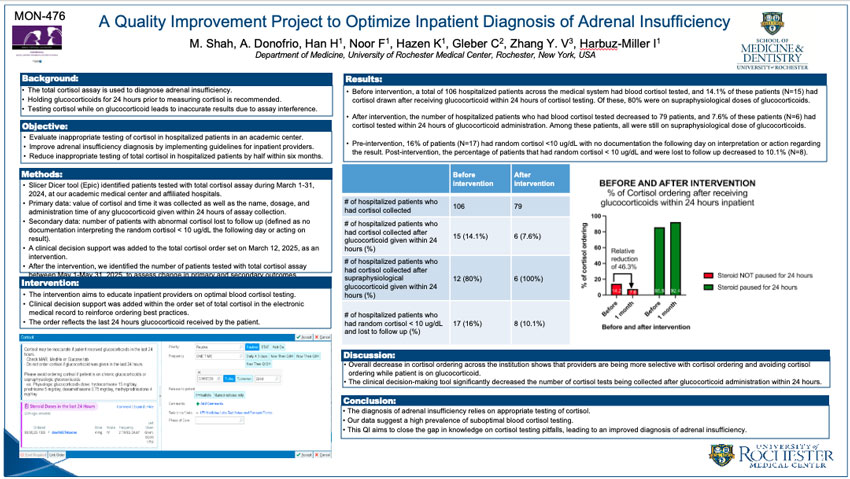
- Before intervention, a total of 106 hospitalized patients across the medical system had blood cortisol tested, and 14.1% of these patients (N=15) had cortisol drawn after receiving glucocorticoid within 24 hours of cortisol testing. Of these, 80% were on supraphysiological doses of glucocorticoids.
- After intervention, the number of hospitalized patients who had blood cortisol tested decreased to 79 patients, and 7.6% of these patients (N=6) had cortisol tested within 24 hours of glucocorticoid administration. Among these patients, all were still on supraphysiological dose of glucocorticoids.
- Pre-intervention, 16% of patients (N=17) had random cortisol <10 ug/dL with no documentation the following day on interpretation or action regarding the result. Post-intervention, the percentage of patients that had random cortisol < 10 ug/dL and were lost to follow up decreased to 10.1% (N=8).
| Before Intervention | After Intervention | |
|---|---|---|
| # of hospitalized patients who had cortisol collected | 106 | 79 |
| # of hospitalized patients who had cortisol collected after glucocorticoid given within 24 hours (%) | 15 (14.1%) | 6 (7.6%) |
| # of hospitalized patients who had cortisol collected after supraphysiological glucocorticoid given within 24 hours (%) | 12 (80%) | 6 (100%) |
| # of hospitalized patients who had random cortisol < 10 ug/dL and lost to follow up (%) | 17 (16%) | 8 (10.1%) |
Discussion
- Overall decrease in cortisol ordering across the institution shows that providers are being more selective with cortisol ordering and avoiding cortisol ordering while patient is on glucocorticoid.
- The clinical decision-making tool significantly decreased the number of cortisol tests being collected after glucocorticoid administration within 24 hours.
Conclusion
- The diagnosis of adrenal insufficiency relies on appropriate testing of cortisol.
- Our data suggest a high prevalence of suboptimal blood cortisol testing.
- This QI aims to close the gap in knowledge on cortisol testing pitfalls, leading to an improved diagnosis of adrenal insufficiency.
Charlotte Blumrosen, M.D., Nathan Rotundo, M.D., Anita Ray, M.D., M.P.H.
University of Rochester Medical Center Internal Medicine and Pediatrics, Rochester, NY
Introduction
- In 2009, the Accreditation Council for Graduate Medical Education (ACGME) updated Internal Medicine (IM) residency program guidelines to recommend that IM residencies increase ambulatory training time and develop training schedules to reduce conflicts between inpatient and outpatient responsibilities1.
- Advancing Innovation in Residency Education (AIRE) pilot in 2018-2023, allowed categorical Peds and Med-Peds programs to trial different approaches to continuity clinic scheduling that include “Y” scheduling by granting a waiver from the following core Residency Committee requirement related to continuity clinic scheduling2.
- Participating program leaders have described an improved ability to focus on current rotations, improved satisfaction with continuity clinic, and improved ability to deliver a consistent curriculum with X+Y scheduling3. Reports on the impact of X+Y scheduling on ambulatory education have shown increased time in the ambulatory setting, improved resident satisfaction with ambulatory time 4, and no significant impact on patient continuity and satisfaction.
- At our institution, the IM residency program made the transition to X+Y in 2014 and has had excellent feedback from both residents and faculty.
Methods
- To align with a 6+2 schedule with 12 educational half days per year, we designed a schedule to provide a 4-year longitudinal ambulatory curriculum for each resident
- Similar to the IM program, each half day was separated into 4 distinct sessions with morning report, a resident-led case presentation as the initial session, and indirect patient care activity curriculum followed by 2 content reviews with board review questions and one skills/communication/workshop session
- Content outlines for the American Board of Pediatrics and the American Board of Internal Medicine were reviewed to align ambulatory content sessions with board certification, with the exclusion of inpatient-specific topics
- A survey was sent to all Med Peds residents to further assess which content areas should be included in the ambulatory sessions vs. are adequately included within educational sessions of other rotations
- The survey also elicited information about learning styles and preferred method of content delivery

Results
- 16 respondents– 50% of all MPRs and 14/24 (60% of R1-R3)
- 5 PGY1, 5PGY2 and 4 PGY3
- For 4th hour session, suggestions of hands–on workshops included
- Joint injections
- POCUS
- MSK Exam and common orthopedic conditions and their work-up
- Nexplanon insertion/removal
- I&D
- IUD placement
- Common dermatology procedures
- Additional topics that were included in 4th hour sessions, such as:
- When referral to subspecialty care is indicated
- Trauma-informed care and education
- Pre-procedural evaluations
- Community Resources
Future Directions
- Follow-up surveys at 4 months and 1 year will be completed for continued resident input in curricular content
- Following each academic half-day, a post session survey will be distributed to all residents with the intent of receiving immediate feedback
References
- Accreditation Council for Graduate Medical Education (ACGME) 2009;Pages http://www.acgme.org/Portals/0/PFAssets/ProgramRequirements/140_internal_medicine_2016.pdf. Accessed 6 Dec 2018.
- Friedland AR, Divatia H, Eldridge J, Maguire M, Hastry C, Chua A, Nichols J, Anttila A, Donnelly J. Quantitative Outcomes of "Y" Scheduling in an Internal Medicine-Pediatrics Residency Program: First Year Data. Cureus. 2025 Jan 19;17(1):e77675. doi: 10.7759/cureus.77675. PMID: 39968443; PMCID: PMC11835468.
- X + Y scheduling models in internal medicine residency programs: a national survey of program directors' perspectives. Noronha C, Chaudhry S, Chacko K, McGarry K, Agrawal A, Yadavalli G, Shalaby M. Am J Med. 2018;131:107–114. doi: 10.1016/j.amjmed.2017.09.012
- Challenges in an X + Y ambulatory model. Ibrahim W, Adam O, Mohamed A, et al. Clin Teach. 2020;17:185–189. doi: 10.1111/tct.13029.
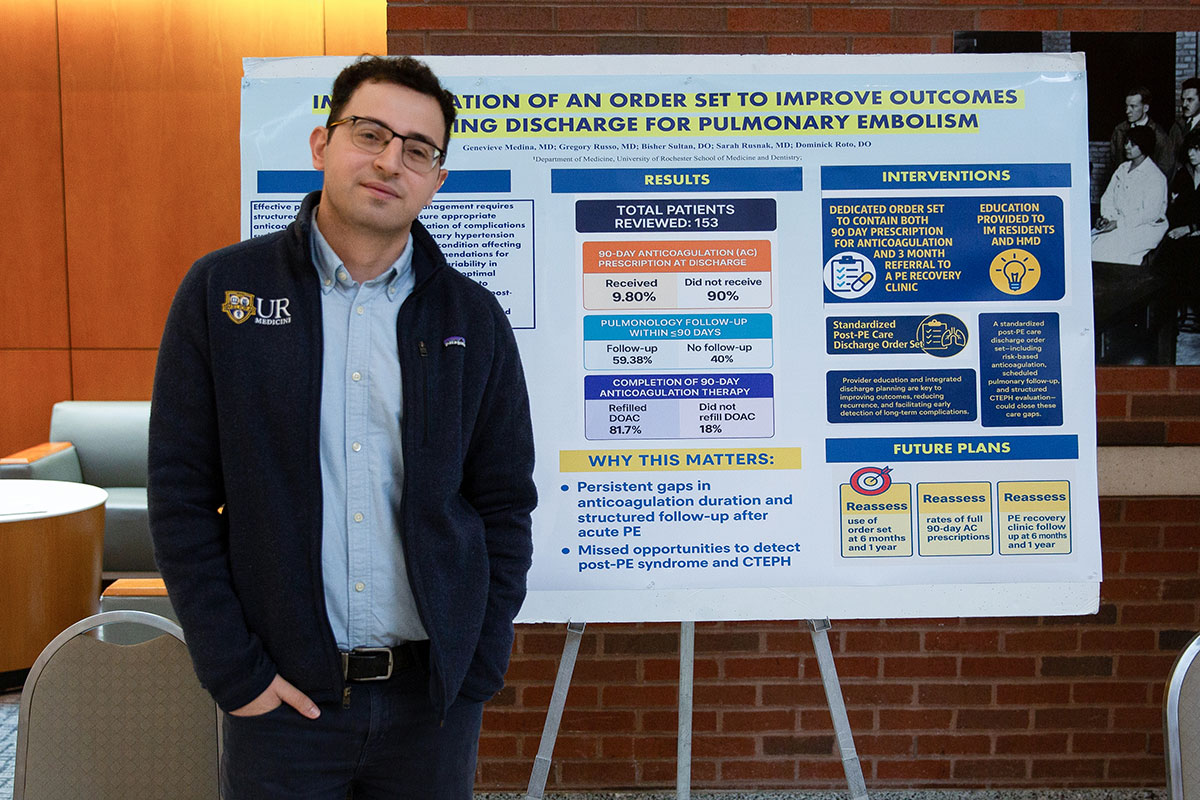
Genevive Medina, M.D.; Gregory Russo, M.D.; Bisher Sultan, D.O.; Sarah Rusnak, M.D., Dominick Roto, D.O.
Department of Medicine, University of Rochester Medical Center
Background
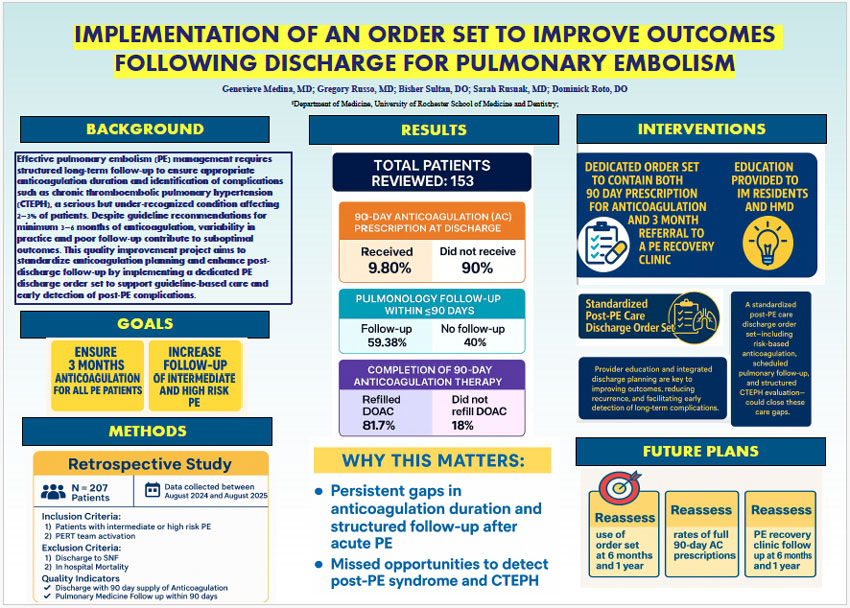
Effective pulmonary embolism (PE) management requires structured long-term follow-up to ensure appropriate anticoagulation duration and identification of complications such as chronic thromboembolic pulmonary hypertension (CTEPH), a serious but under-recognized condition affecting 2–3% of patients. Despite guideline recommendations for minimum 3–6 months of anticoagulation, variability in practice and poor follow-up contribute to suboptimal outcomes. This quality improvement project aims to standardize anticoagulation planning and enhance postdischarge follow-up by implementing a dedicated PE discharge order set to support guideline-based care and early detection of post-PE complications.
Goals
- Ensure 3 months anticoagulation for all PD patients
- Increase follow-up of intermediate and high-risk PE
Methods
Retrospective Study
- N=207 patients
- Data collected between August 2024 and August 2025
Inclusion criteria:
- Patients with intermediate or high-risk PE
- PERT team activation
Exclusion Criteria:
- Discharge to SNF
- In-hospital mortality
Quality Indicators
- Discharge with 90-day supply of anticoagulation
- Pulmonary Medicine follow-up within 90 days
Results
- Total patients reviewed: 153
- 90-Day anticoagulation (AC) prescription at discharge
- Received: 9.8%
- Did not receive: 90%
- Pulmonology follow-up within ≤90 days
- Follow-up: 59.38%
- No follow-up: 40%
- Completion of 90-day anticoagulation therapy
- Refilled DOAC: 81.7%
- Did not refill DOAC: 18%
Why This Matters
- Persistent gaps in anticoagulation duration and structured follow-up after acute PE
- Missed opportunities to detect post-PE syndrome and CTEPH
Interventions
- Dedicated order set to contain both 90-day prescription for anticoagulation and 3-month referral to a PE recovery clinic
- Education provided to IM Residents and HMD
- Standardized post-PE care discharge order set
- A standardized post-PE care discharge order set—including risk-based anticoagulation, scheduled pulmonary follow-up, and structured CTEPH evaluation—could close these care gaps
- Provider education and integrated discharge planning are key to improving outcomes, reducing recurrence, and facilitating early detection of long-term complications
Future Plans
- Reassess: Use of order set at 6 months and 1 year
- Reassess: Rates of full 90-day AC prescriptions
- Reassess: PE recovery clinic follow-up at 6 months and 1 year
Additional Presentations and Posters Submitted
Clinical
Jai Ahluwalia, MD1,2 and Emily Salib, MD1,2
1Department of Medicine, University of Rochester Medical Center; 2Department of Pediatrics, University of Rochester Medical Center
Case Report
A previously healthy 20 year old woman presented to the emergency department with two weeks of fever and abdominal pain. Initial labs showed leukocytosis, anemia, and thrombocytosis. CT of her abdomen and pelvis revealed pleural effusions, diffuse ill-defined hepatic hypodensities, gastric wall thickening, and lymphadenopathy. She was discharged home with plans for gastroenterology follow-up, hepatic MRI and EGD.
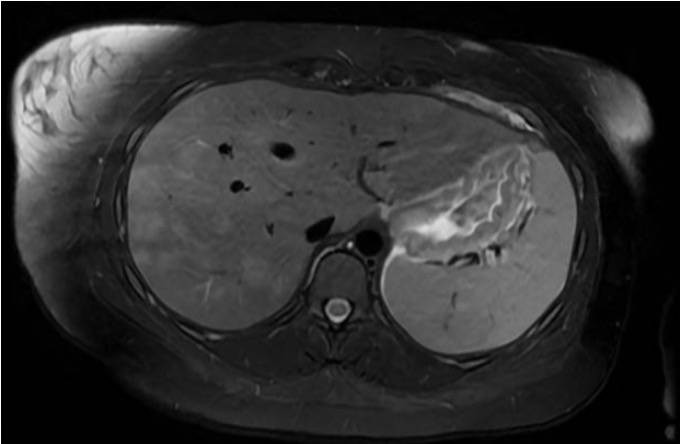
Figure 1: Hepatic MRI demonstrating multiple liver lesions
Two days later, she returned to the ED with worsening abdominal pain and was found to have persistent leukocytosis, anemia, and tachycardia. Pelvic ultrasound revealed a left ovarian cyst and due to cervical motion tenderness, she was admitted and began treatment for pelvic inflammatory disease. Hepatic MRI showed innumerable liver lesions, gastric wall thickening, pleural based pulmonary nodules, infrahilar airspace consolidations, and a pancreatic tail lesion. EGD revealed active gastritis. IR-guided liver biopsy showed steatosis. IR-guided pulmonary biopsy was too high risk due to adjacent vascular structures. An exhaustive infectious disease work-up revealed high Bartonella quintana titers. Due to the concern for culture-negative Bartonella quintana endocarditis, she underwent transesophageal echocardiogram (negative for vegetations) and completed a prolonged course of doxycycline and rifampin. The pulmonary consolidations were treated with antibiotics for pneumonia and a simultaneous rheumatologic work-up was inconclusive.
One month later, she presented with positional chest pain, shortness of breath and polyarthritis. She was febrile, tachycardic, tachypneic and had a persistent leukocytosis. CT chest angiogram showed interval growth of pleural-based pulmonary nodules. Cardiology diagnosed pericarditis and initiated colchicine and ibuprofen. Bronchoscopy for biopsy of the pulmonary nodules was attempted but unsuccessful. She was transferred to Strong Memorial Hospital for EBUS-guided needle aspiration of the lung nodules. Pathology revealed granulomatous disease and sarcoidosis was confirmed. Subsequent ophthalmologic exam showed focal retinitis. She improved on high dose prednisone and was transitioned to methotrexate outpatient.


Figure 2: Axial chest CT prior to diagnosis
Discussion
The complete pathophysiology of sarcoidosis is incompletely understood but is broadly a multisystem, inflammatory condition mediated by an inverted CD4/CD8 T-cell ratio and various inflammatory markers. Acute Sarcoid presents with the well-recognized constellation of symptoms known as Lofgren Syndrome: erythema nodosum, bilateral hilar lymphadenopathy and polyarthritis. However, as this case demonstrates, sarcoid may also present with a wide range of extra-pulmonary manifestations. Our patient had multiorgan disease involving the lung, liver, heart, stomach, musculoskeletal system and possibly eyes which resulted in diagnostic delay, a battery of invasive procedures and testing, misdiagnoses, and exposure to extended courses of unnecessary antibiotics. While her work-up felt prolonged and disjointed, spanning seven weeks and including 25 days of hospitalization and a hospital transfer, the average diagnostic lag in all types of sarcoidosis is nearly 8 months.
This case highlights the need for a high index of suspicion of sarcoid even in the setting of seemingly disparate multi-system complaints as well as the importance of interprofessional collaboration. Identifying institutional abilities and having strong ties between institutions ultimately helped this patient reach a definitive diagnosis and receive the care she needed.
Sarcoidosis is not just a pulmonary disease...
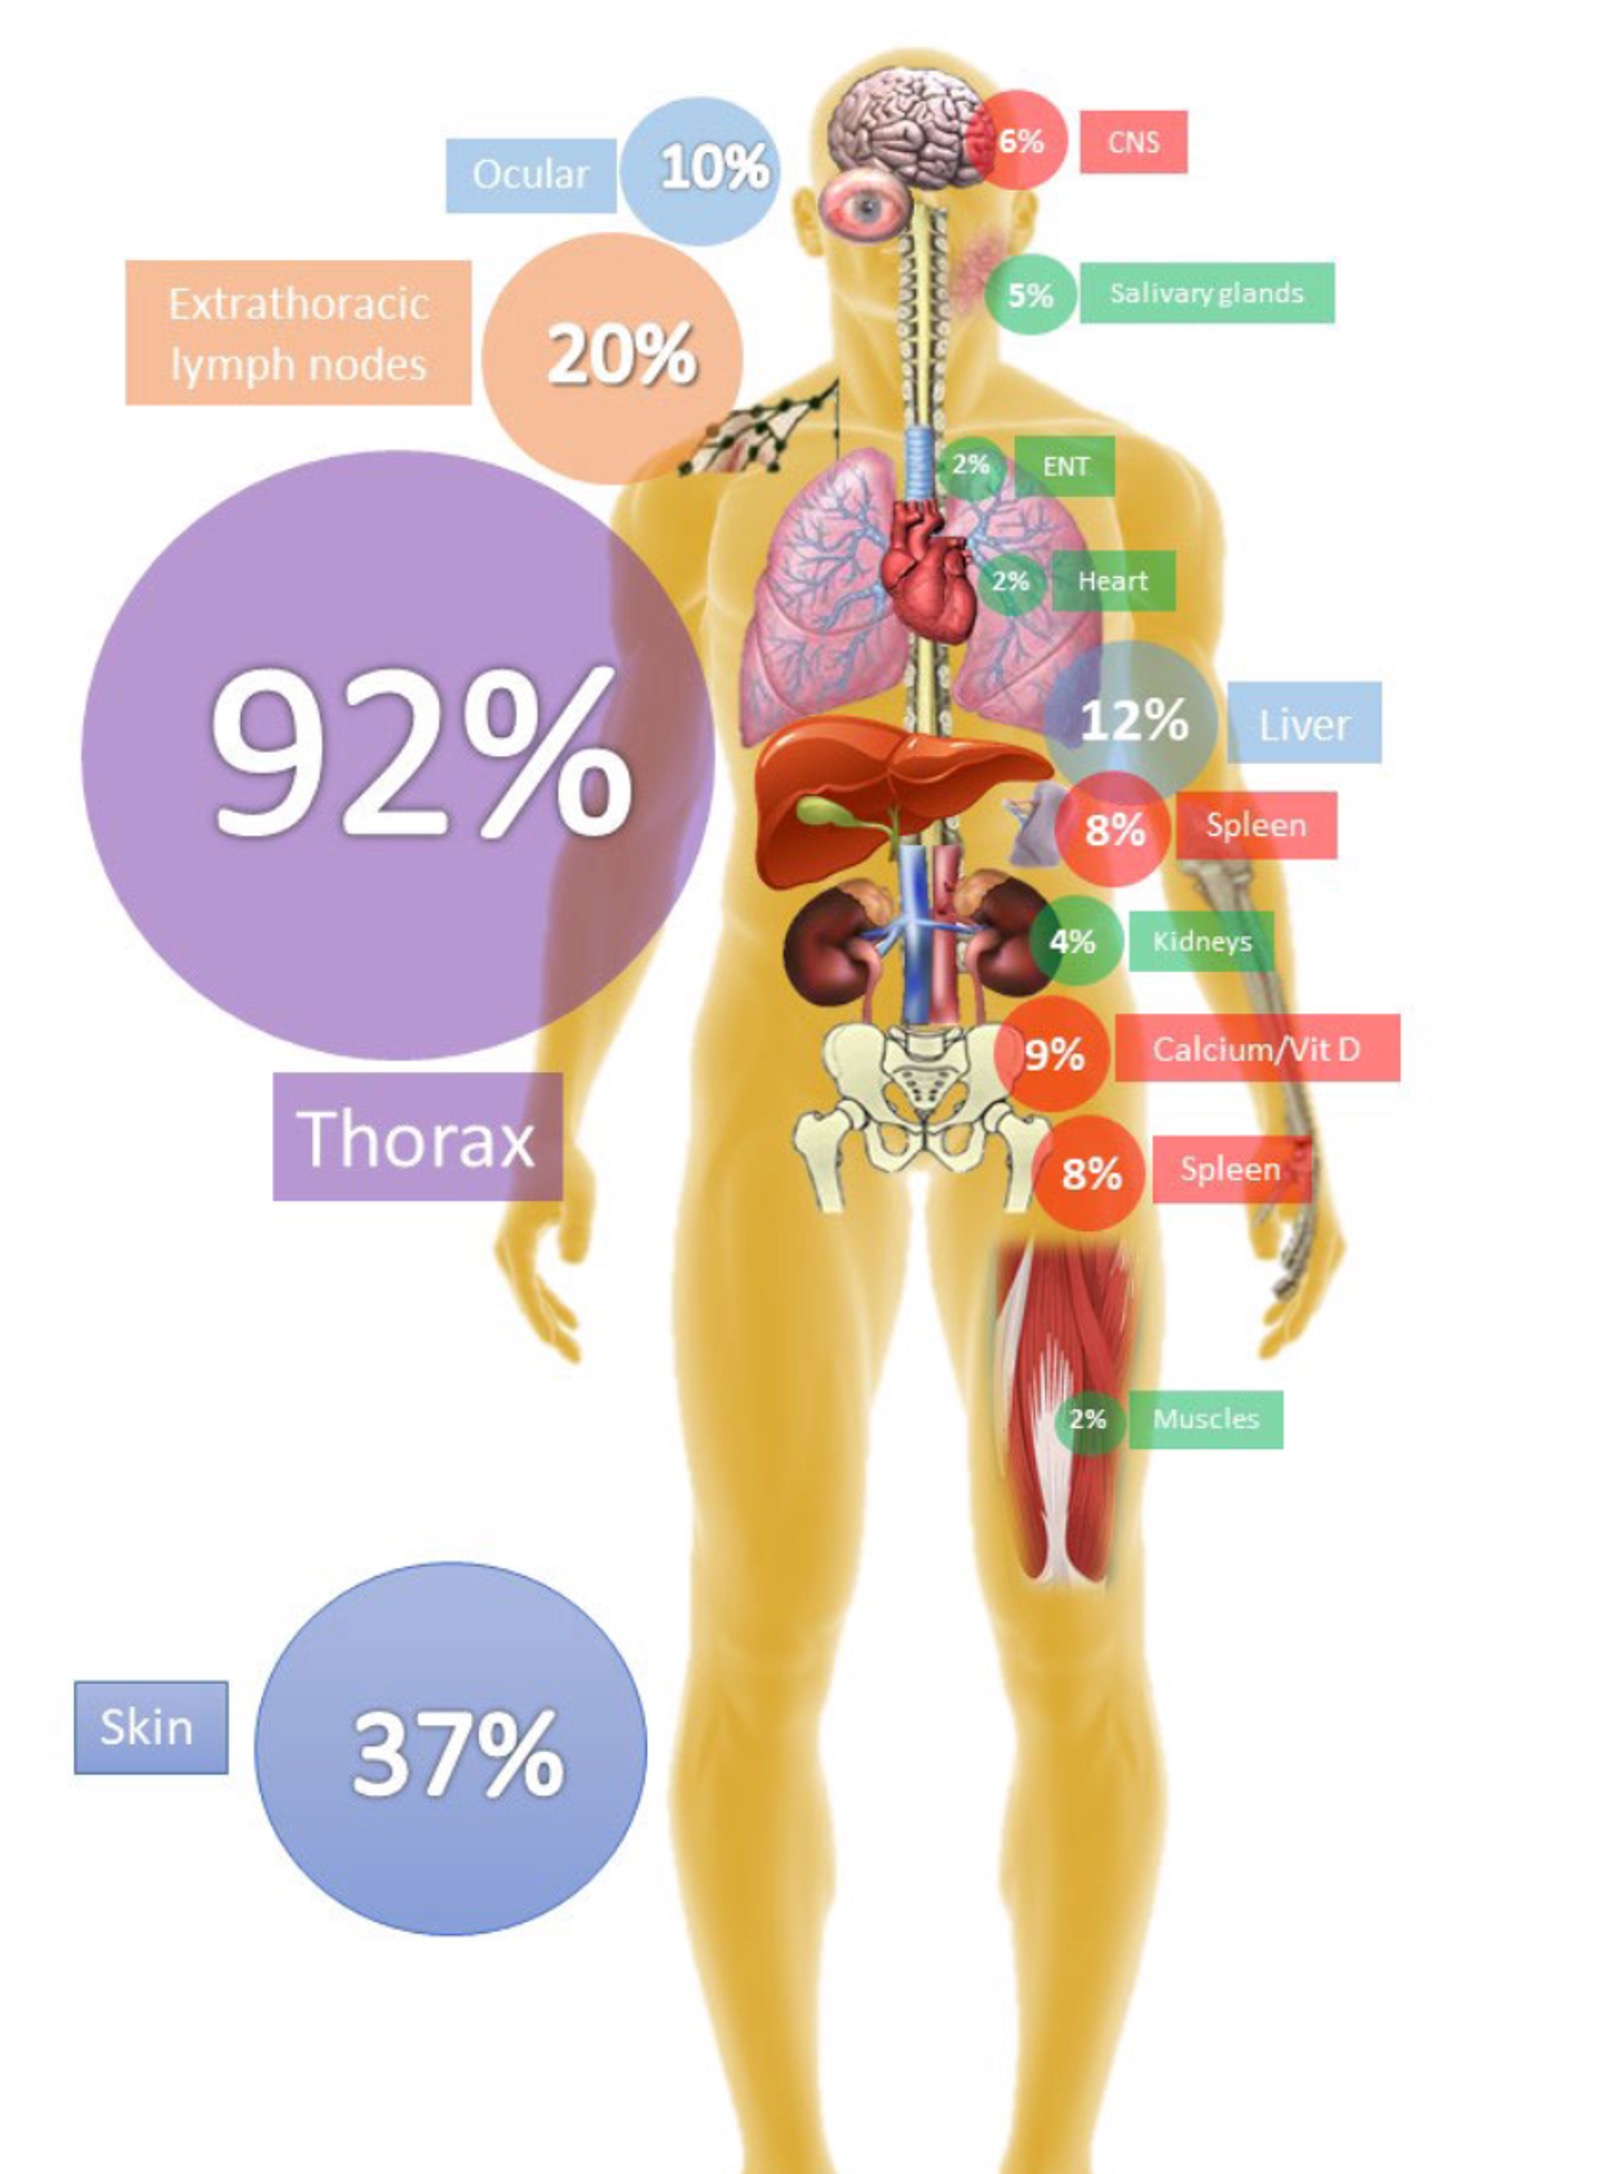
In a Spanish cohort of 1521 patients, 72% had exrathoracic disease and 34% had systemic disease (at least 2 extrathoracic organs involved)
References
- Ramos-Casals, M. (2019). Sarcoidosis as a Systemic Disease. Clinical and Epidemiological Characterization of Systemic Phenotype in 1521 Patients.
- Mahalwar G, Kumar A, Agrawal A, Bhat A, Furqan M, Yesilyaprak A, Verma BR, Chan N, Schleicher M, Neto MLR, Xu B, Jellis CL, Klein AL. Pericardial Involvement in Sarcoidosis. Am J Cardiol. 2022 May 1;170:100-104. doi: 10.1016/j.amjcard.2022.01.025. Epub 2022 Feb 25. PMID: 35227500.
- Namsrai T, Phillips C, Parkinson A, Gregory D, Kelly E, Cook M, Desborough J. Diagnostic delay of sarcoidosis: an integrated systematic review. Orphanet J Rare Dis. 2024 Apr 11;19(1):156. doi: 10.1186/s13023-024-03152-7. PMID: 38605384; PMCID: PMC11010435.
Nathan Logan, MD; Emily Salib, MD
University of Rochester Medical Center
Introduction
- Paradoxical vocal cord movement (PVCM) is inappropriate adduction of the vocal cords during inspiration
- Results in acute respiratory distress and stridor that may mimic asthma or anaphylaxis
- First-line treatment is breathing techniques that allow vocal cord relaxation, bronchodilators and corticosteroids are not indicated1
Case Description
Initial Presentation
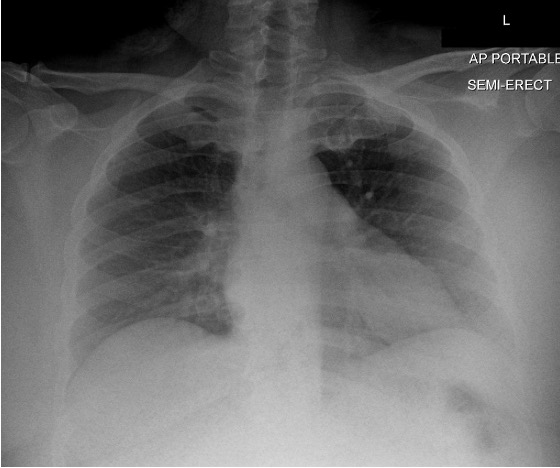
40-year-old woman with history of asthma, anxiety, depression, and hypertension presented to the ED with 2 weeks of paroxysmal cough, shortness of breath, and an episode of mild confusion. She had previously presented to urgent care three times for these symptoms. Diagnosed with influenzas A and treated with courses of corticosteroids, antibiotics, and bronchodilators outpatient. Notably had driven from Florida to Rochester for her father’s funeral and three weeks prior had also experienced a miscarriage. Her CXR from the ED is shown:
Hospital Care
- Patient was tachypneic and hypertensive but afebrile and otherwise stable, admitted for inpatient management of asthma exacerbation
- Continued to have dyspnea and cough despite treatment with systemic and inhaled corticosteroids and inhaled bronchodilators
- Pulmonology was consulted due to poor response to treatment, recommended extending current IV steroids and inhaled therapies with modifications to her outpatient asthma regimen at discharge
- Seven days into her admission, she was asked to describe her symptoms in more detail. She noted intermittent episodes of facial flushing followed by coughing, inability to breathe, substernal chest tightness, and post-tussive emesis, all associated with a feeling of panic
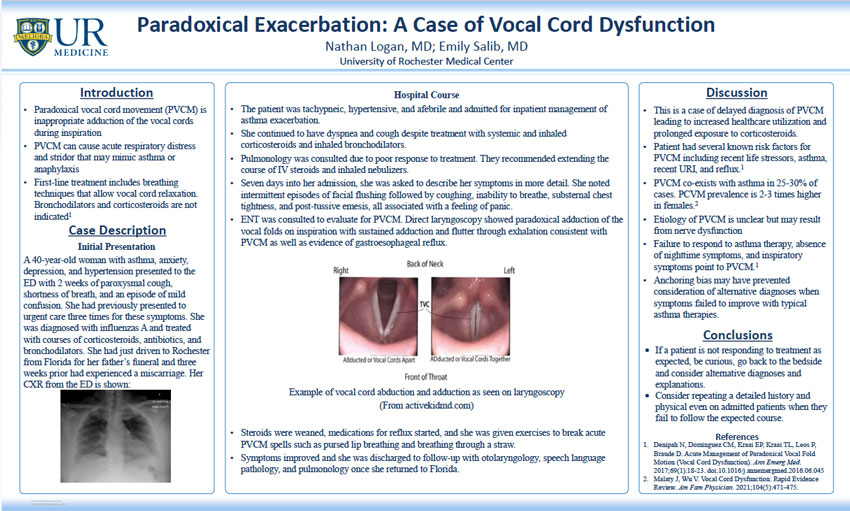
- ENT was consulted to evaluate for PVCM, laryngoscopy showed paradoxical adduction of the vocal folds on inspiration with sustained adduction and flutter through exhalation consistent with PVCM as well as evidence of gastroesophageal reflux
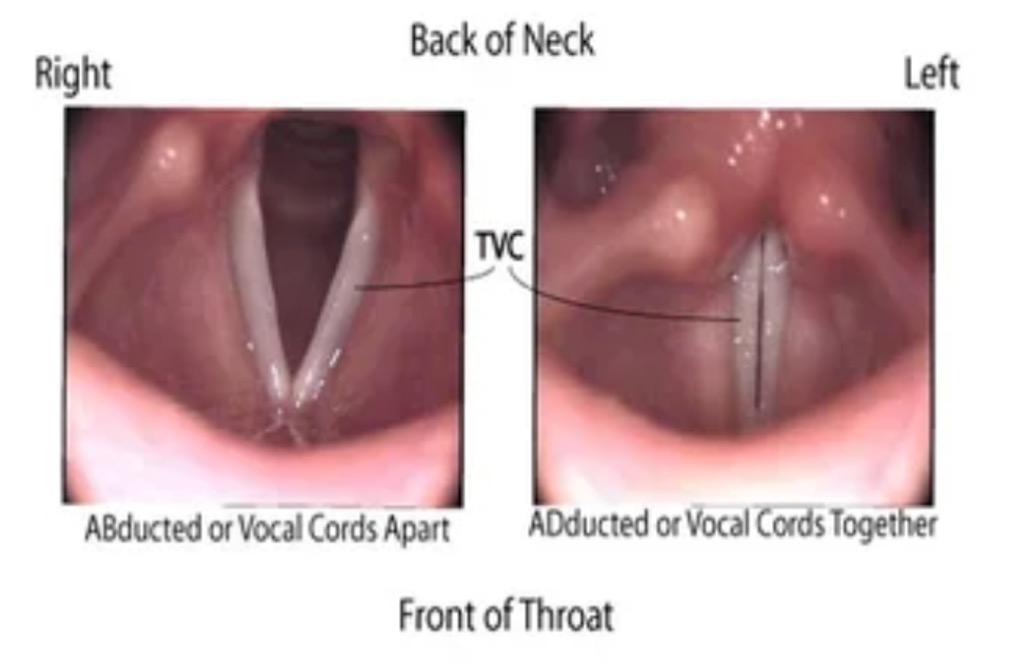
Example of vocal cord abduction and adduction as seen on laryngoscopy (From activekidmd.com)
- Steroids were weaned, medications for reflux were started, and she was given exercises to break acute PVCM spells such as pursed lip breathing or breathing through a straw
- Symptoms improved and she was discharged and advised to follow-up with otolaryngology, speech language pathology, and pulmonology once she returned home.
Discussion
- Case of delayed diagnosis of PVCM leading to increased healthcare utilization and prolonged exposure to corticosteroids
- Patient had several known risk factors for PVCM including recent life stressors, asthma, recent URI, and reflux1
- PVCM co-exists with asthma in 25-30% of cases, PCVM prevalence is 2-3 times higher in females2
- Etiology of PVCM is unclear, thought to result from nerve dysfunction
- Failure to respond to asthma therapy, absence of nighttime symptoms, and inspiratory symptoms point to PVCM1
- Anchoring bias may have prevented consideration of alternative diagnoses when typical asthma therapies failed to improve symptoms
Take-Aways
- If a patient is not responding to therapies for their diagnosis as expected, consider alternative and/or additional diagnoses
- Obtaining a detailed history and physical on patients that have been admitted for several days may provide further diagnostic clarity and allow for better monitoring of treatment response
References
- Denipah N, Dominguez CM, Kraai EP, Kraai TL, Leos P, Braude D. Acute Management of Paradoxical Vocal Fold Motion (Vocal Cord Dysfunction). Ann Emerg Med. 2017;69(1):18-23. doi:10.1016/j.annemergmed.2016.06.045
- Malaty J, Wu V. Vocal Cord Dysfunction: Rapid Evidence Review. Am Fam Physician. 2021;104(5):471-475.
Bethany Marbaker, MD1, Emily Salib, MD1,2
1URMC Internal Medicine-Pediatrics Residency Program, 2Highland Hospital
Case Presentation #1
An 84-year-old man with a history of hypertension, polymyalgia rheumatica, gout, and gastroesophageal reflux presented to the hospital in June with acute onset of diarrhea, nausea, malaise, and fatigue, associated with low-grade fever and lightheadedness with position changes.
Lab work on presentation was significant for:
- White blood cell count 16.5 (neutrophil 8.6, monocyte 5.4, bands 10%, metamyelocytes 8%, myelocytes 1%)
- Platelet count 16
- ALT 51 / AST 79
Hospital Course:
- Started on empiric broad spectrum antibiotics with cefepime and metronidazole for presumed gastrointestinal infection.
- Hematology was consulted and peripheral smear was performed, which was concerning for acute leukemia. He developed anemia during his hospitalization. Bone marrow biopsy was recommended, which the patient initially declined but later pursued.
- Several days into admission, he reported a large population of deer ticks in his yard and recalled several prior tick bites. Lyme, anaplasma, ehrlichia, and babesia testing was sent, and doxycycline was initiated empirically.
- Anaplasma PCR was subsequently positive and bone marrow biopsy was consistent with chronic myelomonocytic leukemia (CMML).
He received a two-week course of doxycycline with improvement in his blood counts and symptoms. He is being monitored off of CMML-directed therapy given his low-risk profile and preference

Figure 1. Morulae of anaplasmosis within a granulocyte. Image from Dr. Eddy J Chen and Dr. German Pihan, Departments of Medicine and Pathology, Beth Israel Deaconess Medical Center, Boston, MA
Case Presentation #2
A 72-year-old woman presented to the hospital in June with acute onset of fever, drenching sweats, headache, and anorexia. Pertinent history included travel to Indonesia about a month prior, recent COVID-19 infection about three weeks prior, and recent time spent at her lake house in Western NY.
Lab work on presentation was significant for:
- White blood cell count 3.5 (reactive lymph 11.2%, bands 2%)
- Hemoglobin 13.7 / Hematocrit 41.4
- Platelet count 101
- Na 133
- ALT 223 / AST 263 / Alk phos 293
Hospital Course:
- Infectious Disease was consulted given travel history and concern for possible malaria.
- Broad infectious workup was initiated including hepatitis panel, respiratory viral panel, malaria antigen with peripheral smears, stool bacterial PCR, CMV, EBV, Lyme, anaplasma, ehrlichia, and babesia testing.
- Empiric doxycycline was offered given suspicion for tick-borne illness, but was declined by the patient.
Following discharge, her anaplasma PCR returned positive. She completed a course of doxycycline with resolution of her symptoms and laboratory abnormalities.

Figure 2. Incidence of reported anaplasmosis in the United States in 2023. Image from The Centers for Disease Control and Prevention anaplasmosis statistics and epidemiology
Discussion
This case series demonstrates clinical scenarios where alternate diagnoses were initially suspected due to patient presentation and history. Neither patient initially disclosed history of outdoor exposure or tick bite and both cases required clinicians to maintain a high index of suspicion for the diagnosis.
- Anaplasmosis is a disease caused by Anaplasma phagocytophilum
- Transmitted via tick vectors, hosts are deer and mice
- Incidence has steadily increased over the last 20 years
- Infection is most common in the spring and summer
- Clinical manifestations include:
- Fever
- Nonspecific generalized symptoms: malaise, myalgias, arthralgias, GI symptoms
- Rash (rarer in anaplasmosis, could suggest co-infection)
- Leukopenia, elevated bands, thrombocytopenia, anemia, elevate creatinine, elevated LFTs
- Treatment with doxycycline should be initiated as soon as disease is suspected to minimize risk of progression
Conclusions
Anaplasmosis is a disease entity that has had a significant increase in incidence in recent years. Clinical presentations can range from mild to severe and can also mimic a number of other disease processes. Clinicians should consider anaplasmosis as a possible diagnosis, even in cases where other diagnoses remain on the differential or where patients do not endorse significant outdoor exposure. Prompt initiation of empiric doxycycline (prior to result of PCR testing) is recommended when the disease is suspected.
References
- Bakken JS, Aguero-Rosenfeld ME, Tilden RL, et al. Serial measurements of hematologic counts during the active phase of human granulocytic ehrlichiosis. Clinical Infectious Diseases. 2001;32(6):862-870.
- Bakken JS, Dumler S. Human granulocytic anaplasmosis. Infectious Disease Clinics of North America. 2008;22(3):433.
- Bakken JS, Dumler JS. Human granulocytic ehrlichiosis. Clinical Infectious Disease. 2000; 31:554.
- CDC. Clinical Testing and Diagnosis for Ehrlichiosis. Ehrlichiosis. Published May 21, 2025. Accessed September 24, 2025. https://www.cdc.gov/ehrlichiosis/hcp/diagnosis-testing/?CDC_AAref_Val=https://www.cdc.gov/ehrlichiosis/healthcare-providers/diagnosis.html
- CDC. Epidemiology and Statistics. Anaplasmosis. Published June 25, 2025. Accessed September 24, 2025. https://www.cdc.gov/anaplasmosis/hcp/statistics/?CDC_AAref_Val=https://www.cdc.gov/anaplasmosis/stats/index.html
- Champman AS, Bakken JS, Folk SM, et al. Diagnosis and management of tickborne rickettsial diseases: Rocky Mountain Spotted Fever, Ehrlichiosis, and Anaplasmosis-United States: A practical guide for physicians and other health-care and public health professionals. MMWR Recomm Rep 2006; 55(RR-4):1.
- Chen SM, Dumler JS, Bakken JS, Walker DH. Identification of a granulocytotropic Ehrlichia species as the etiologic agent of human disease. Journal of Clinical Microbiology. 1994; 32:589.
- Dahlgren FS, Heitman KN, Drexler NA, et al. Human granulocytic anaplasmosis in the United States from 2008 to 2012: a summary of national surveillance data. Am J Trop Med Hyg 2015; 93:66.
- Dumler JS, Bakken JS. Ehrlichial diseases of humans: emerging tick-borne infections. Clinical Infectious Diseases. 1995;20(5):1102.;
- Dumler JS, Bakken JS. Human granulocytic ehrlichiosis in Wisconsin and Minnesota: a frequent infection with the potential for persistence. Journal of Infectious Disease. 1996;173(4):1027.
- Dumler JS, Choi KS, Garcia-Garcia JC, et al. Human granulocytic anaplasmosis and Anaplasma phagocytophilum. Emerg Infect Dis 2005; 11:1828.
Ali Murra, MD; Matt Simson, MD; Amit Bansal, MD
Department of Medicine, University of Rochester School of Medicine and Dentistry/p>
Introduction
Cabozantinib is a vascular endothelial growth factor receptor inhibitor – one of the four classes of tyrosine-kinase inhibitors – and is used in the treatment of renal cell carcinoma, medullary carcinoma, and hepatocellular carcinoma1,2. Other classes of TKIs have been associated with various atrial and ventricular arrythmias including sinus bradycardia among other cardiotoxicities but have not been previously associated with VEGF-Rs.
Hypertension is the most commonly identified cardiotoxicity associated with cabozantinib3. Rarely is reversible cardiomyopathy an adverse effect. To date, there have been no reports of cabozantinib-associated arrythmias, and in particular sinus bradycardia.
Here, we present a case of asymptomatic sinus bradycardia that correlates with initiation of cabozantinib
Case Presentation
HPI: A 58-year-old female presents to outpatient cardio-oncology office for progressive, worsening, asymptomatic bradycardia.
PMH: Renal cell carcinoma with metastasis to the bone in 2021 previously treated with ipilimumab and nivolumab. Transitioned to cabozantinib monotherapy due to side effects.
Physical Exam: Bradycardia with regular rhythm and no appreciable murmurs, rubs, or gallops.
Relevant studies, labs: 7-day e-patch 5/22/25 with sinus bradycardia with rate of 48 bpm. TTE with normal LV size and LVEF and no valvular disease. TSH slightly elevated, T4 within normal limits. No electrolyte disturbances.
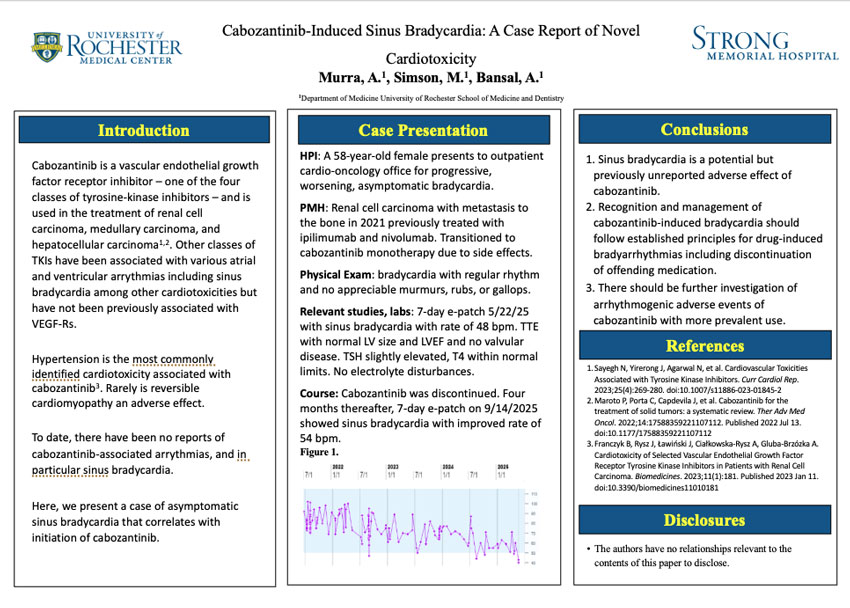
Course: Cabozantinib was discontinued. Four months thereafter, 7-day e-patch on 9/14/2025 showed sinus bradycardia with improved rate of 54 bpm.
Figure 1
Conclusions
- Sinus bradycardia is a potential but previously unreported adverse effect of cabozantinib.
- Recognition and management of cabozantinib-induced bradycardia should follow established principles for drug-induced bradyarrhythmias including discontinuation of offending medication.
- There should be further investigation of arrhythmogenic adverse events of cabozantinib with more prevalent use.
References
- Sayegh N, Yirerong J, Agarwal N, et al. Cardiovascular Toxicities Associated with Tyrosine Kinase Inhibitors. Curr Cardiol Rep. 2023;25(4):269-280. doi:10.1007/s11886-023-01845-2
- Maroto P, Porta C, Capdevila J, et al. Cabozantinib for the treatment of solid tumors: a systematic review. Ther Adv Med Oncol. 2022;14:17588359221107112. Published 2022 Jul 13. doi:10.1177/17588359221107112
- Franczyk B, Rysz J, Ławiński J, Ciałkowska-Rysz A, Gluba-Brzózka A. Cardiotoxicity of Selected Vascular Endothelial Growth Factor Receptor Tyrosine Kinase Inhibitors in Patients with Renal Cell Carcinoma. Biomedicines. 2023;11(1):181. Published 2023 Jan 11. doi:10.3390/biomedicines11010181
Disclosures
The authors have no relationships relevant to the contents of this paper to disclose.
Mohammad Naser, M.D.; Haris Jawaid, M.D.; Julie Ann N. Warner, M.D.; Jason J. Lyons, M.D.
Rochester Regional Health
Introduction
- Pulmonary alveolar proteinosis (PAP) is a rare diffuse lung disease that is characterized by the accumulation of surfactant-derived lipoproteinaceous material within the alveoli.
- PAP is classified into three subtypes: primary (autoimmune, driven by anti-GM-CSF antibodies), secondary (associated with inhalational toxins, infections, or hematologic disorders), and congenital (genetic).
- PAP has been reported as a novel complication of chronic vaping, although its underlying pathophysiology remains poorly understood.
- This case report presents a patient with a history of vaping who developed PAP. By integrating clinical, radiographic, and histopathologic findings, this report contributes to the expanding understanding of vaping-associated PAP and underscores the importance of multidisciplinary management in addressing this evolving public health concern.
Case Presentation
- A 45-year-old woman with a history of interstitial lung disease attributed to prior intravenous (IV) drug use, asthma and polysubstance use disorder (managed with Suboxone.
- Patient presented with severe shortness of breath and acute hypoxic respiratory failure following recent use of a nicotine vape pen.
- Initial evaluation excluded infectious, hematologic and cardiac causes. Initial chest computed tomography (CT) revealed bilateral diffuse ground-glass opacities (similar to baseline).
- Despite initial empiric treatment, her condition deteriorated, necessitating escalating respiratory support, intubation with mechanical ventilation, and ICU admission. A repeat chest CT demonstrated a new 'crazy paving' pattern on a background of ground-glass opacities.
- Bronchoalveolar lavage (BAL) yielded pink-tinged fluid. Cytopathological analysis showed periodic acid-Schiff (PAS)-positive globules within macrophages and extracellularly in a background of acute inflammation, with no evidence of malignancy.
- These findings were strongly suggestive of pulmonary alveolar proteinosis (PAP). Anti-GM-CSF antibody testing could not be done.

Figure 1. Diffuse airspace disease, with more confluent nodular opacities throughout the lungs, with prevalence in the upper lung zones compared with the bases. There is underlying crazy paving.

Figure 2. Cell block stained with PAS-D (Periodic acid-Schiff with diastase) (40x). Solid black arrows indicate extracellular material, while the open black arrow denotes macrophages containing granular cytoplasmic material.

Figure 3. Pathology smears from BAL fluid, stained with Papanicolaou stain (40x). Open arrows highlight macrophages containing granular material. A predominantly neutrophilic inflammatory background is present.
Treatment and Outcome
- Despite treatment with broad-spectrum antimicrobials, antifungals, corticosteroids, maximal ventilatory support, airway pressure release ventilation (APRV), and prone positioning, her respiratory failure persisted, necessitating veno-venous extracorporeal membrane oxygenation (VV-ECMO).
- Whole lung lavage (WLL) was unsuccessful, the procedure was aborted due to poor fluid return. Lung transplantation was considered but declined due to her substance use history.
- Given her poor prognosis, care was transitioned to comfort measures, and the patient subsequently passed away.
Discussion
- This case emphasizes vaping as a trigger for secondary PAP and the importance of BAL in differentiating it from other differentials like ARDS.
- Unlike primary PAP, which is driven by anti-GM-CSF autoantibodies, secondary PAP arises from alveolar macrophage dysfunction due to toxins or infections. There is evidence of anti-GM-CSF positivity in PAP associated with vaping as the underlying etiology alluding to possible toxin mediated autoimmune activation Literature review identified two similar cases, each with a distinct course and outcomes.
- While APRV and ECMO may stabilize refractory cases, whole lung lavage limitations in secondary PAP underscore the need for research into adjunctive therapies. Substance cessation remains pivotal to expanding therapeutic options, including transplant.
Take Home Points
- Vaping is an emerging etiology of secondary PAP. BAL is essential for differentiating it from ARDS.
- Secondary PAP reflects macrophage dysfunction, with potentially vaping induced toxin-mediated autoimmune activation against GM-CSF.
- APRV, ECMO, and WLL are among treatment options for PAP, but efficacy is limited; substance cessation is essential, and the development of new therapies is needed, with transplant reserved for refractory cases.

Research
Paul Hart, M.D.; Sneha Limaye, M.D.; Natalia Aerton, M.D.; Jeffrey Fitch, M.D.; Erin Armenia, M.D.; Maria Mackin, B.S., M.S., CNMT RT (N) FASNC; Leway Chen, M.D. M.P.H; Anas Jawaid, M.D.; Ronald G. Schwartz, M.D., M.S., MASNC
University of Rochester Medical Center
Introduction
- Cardiac allograft vasculopathy (CAV) detected by invasive coronary angiography (ICA) remains a major cause of morbidity and mortality in patients after orthotropic heart transplantation (OHT)1
- Dynamic flow imaging with Positron Emission Tomography (PET), myocardial blood flow (MBF) and MBF Reserve (MBFR) is increasingly used for routine CAV surveillance in OHT patients to limit risks associated with ICA. 2,3,4
- Dynamic flow assessment with CZT SPECT MBF and MBFR correlates highly with PET.5,6
- The value of dynamic flow CZT SPECT MBF and MBFR for CAV surveillance testing in OHT patients has been proposed.6
Methods
- Dynamic flow MBF, MBFR was added to routine rest and regadenoson vasodilator MPI with Tc-99m sestamibi using CZT D-SPECT gamma camera (Spectrum Dynamics Medical, Sarasota, FL) for CAV surveillance testing beginning in February 2021.
- Commercially available MBF software (Cedars Sinai) was used as recommended by camera manufacturer.
- IRB approved secondary analysis of RedCap quality assurance database of stress and rest MBF and MBFR by CZT SPECT and CAV classification by ICA was performed in patients who had both studies performed within 12 months.
- Secondary analyses of MBF and MBFR (mean ± SD) among CAV categories were performed with unpaired two-tailed t-test.
- MBF data were compared in patient groups with CAV (CAV 1,2,3) and without CAV (0) and in patients with high risk (CAV 2,3) vs. low risk (CAV 0,1) CAV.
Table 1a
| CAV0 | CAV1 | CAV2 | CAV3 | |
|---|---|---|---|---|
| AVG | 0.70 | 0.73 | 0.52 | 0.37 |
| SD | 0.25 | 0.21 | 0.17 | 0.17 |
| N | 67 | 32 | 5 | 6 |
Table 1b
| CAV0 | CAV1 | CAV2 | CAV3 | |
|---|---|---|---|---|
| AVG | 2.13 | 1.83 | 1.52 | 1.04 |
| SD | 0.81 | 0.77 | 0.46 | 0.58 |
| N | 67 | 32 | 5 | 6 |
Table 1c
| CAV0 | CAV1 | CAV2 | CAV3 | |
|---|---|---|---|---|
| AVG | 3.29 | 2.68 | 3.08 | 3.12 |
| SD | 1.25 | 1.18 | 0.69 | 1.55 |
| N | 67 | 32 | 5 | 6 |
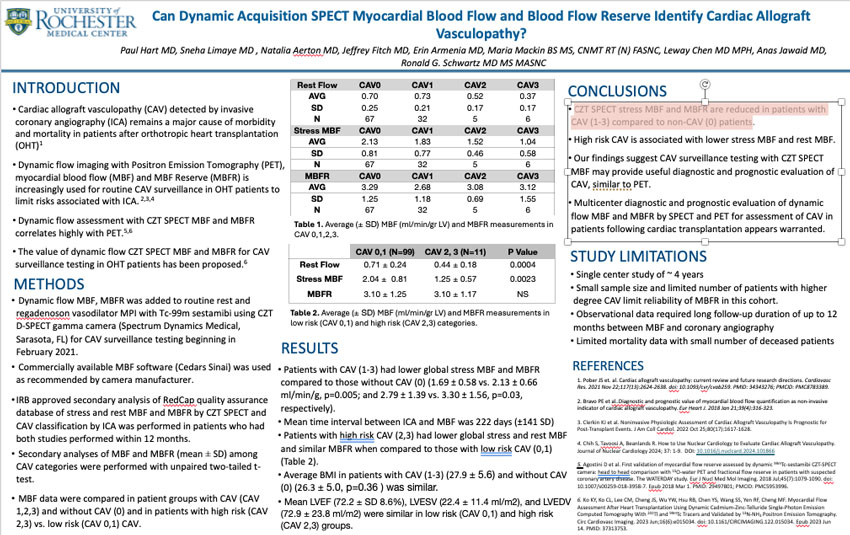
Table 1 a-c. Average (± SD) MBF (ml/min/gr LV) and MBFR measurements in CAV 0,1,2,3.
Table 2
| CAV 0,1 (N=99) | CAV 2, 3 (N=11) | P Value | |
|---|---|---|---|
| Rest Flow | 0.71 ± 0.24 | 0.44 ± 0.18 | 0.0004 |
| Stress MBF | 2.04 ± 0.81 | 1.25 ± 0.57 | 0.0023 |
| MBFR | 3.10 ± 1.25 | 3.10 ± 1.17 | NS |
Table 2. Average (± SD) MBF (ml/min/gr LV) and MBFR measurements in low risk (CAV 0,1) and high risk (CAV 2,3) categories.
Results
- Patients with CAV (1-3) had lower global stress MBF and MBFR compared to those without CAV (0) (1.69 ± 0.58 vs. 2.13 ± 0.66 ml/min/g, p=0.005; and 2.79 ± 1.39 vs. 3.30 ± 1.56, p=0.03, respectively).
- Mean time interval between ICA and MBF was 222 days (±141 SD)
- Patients with high risk CAV (2,3) had lower global stress and rest MBF and similar MBFR when compared to those with low risk CAV (0,1) (Table 2).
- Average BMI in patients with CAV (1-3) (27.9 ± 5.6) and without CAV (0) (26.3 ± 5.0, p=0.36 ) was similar.
- Mean LVEF (72.2 ± SD 8.6%), LVESV (22.4 ± 11.4 ml/m2), and LVEDV (72.9 ± 23.8 ml/m2) were similar in low risk (CAV 0,1) and high risk (CAV 2,3) groups.
Conclusions
- CZT SPECT stress MBF and MBFR are reduced in patients with CAV (1-3) compared to non-CAV (0) patients.
- High risk CAV is associated with lower stress MBF and rest MBF.
- Our findings suggest CAV surveillance testing with CZT SPECT MBF may provide useful diagnostic and prognostic evaluation of CAV, similar to PET.
- Multicenter diagnostic and prognostic evaluation of dynamic flow MBF and MBFR by SPECT and PET for assessment of CAV in patients following cardiac transplantation appears warranted.
Study Limitations
- Single center study of ~ 4 years
- Small sample size and limited number of patients with higher degree CAV limit reliability of MBFR in this cohort.
- Observational data required long follow-up duration of up to 12 months between MBF and coronary angiography
- Limited mortality data with small number of deceased patients
References
- Pober JS et. al. Cardiac allograft vasculopathy: current review and future research directions. Cardiovasc Res. 2021 Nov 22;117(13):2624-2638. doi: 10.1093/cvr/cvab259. PMID: 34343276; PMCID: PMC8783389.
- Bravo PE et al..Diagnostic and prognostic value of myocardial blood flow quantification as non-invasive indicator of cardiac allograft vasculopathy. Eur Heart J. 2018 Jan 21;39(4):316-323.
- Clerkin KJ et al. Noninvasive Physiologic Assessment of Cardiac Allograft Vasculopathy Is Prognostic for Post-Transplant Events. J Am Coll Cardiol. 2022 Oct 25;80(17):1617-1628.
- Chih S, Tavoosi A, Beanlands R. How to Use Nuclear Cardiology to Evaluate Cardiac Allograft Vasculopathy. Journal of Nuclear Cardiology 2024; 37: 1-9. DOI: 10.1016/j.nuclcard.2024.101866
- Agostini D et al. First validation of myocardial flow reserve assessed by dynamic 99mTc-sestamibi CZT-SPECT camera: head to head comparison with 15O-water PET and fractional flow reserve in patients with suspected coronary artery disease. The WATERDAY study. Eur J Nucl Med Mol Imaging. 2018 Jul;45(7):1079-1090. doi: 10.1007/s00259-018-3958-7. Epub 2018 Mar 1. PMID: 29497801; PMCID: PMC5953996.
- Ko KY, Ko CL, Lee CM, Cheng JS, Wu YW, Hsu RB, Chen YS, Wang SS, Yen RF, Cheng MF. Myocardial Flow Assessment After Heart Transplantation Using Dynamic Cadmium-Zinc-Telluride Single-Photon Emission Computed Tomography With 201Tl and 99mTc Tracers and Validated by 13N-NH3 Positron Emission Tomography. Circ Cardiovasc Imaging. 2023 Jun;16(6):e015034. doi: 10.1161/CIRCIMAGING.122.015034. Epub 2023 Jun 14. PMID: 37313753.
Muhammad Ishaq, M.D.; Masroor Anwar, M.D.; Hazem Taifour, M.D.; Waasay Khan, M.D.; Abdul Monem Al Riahi, M.D.; David Christian Corteville, M.D.
Unity Hospital, Rochester Regional HealthBackground
Left atrial appendage occlusion (LAAO) is well known procedure for stroke prevention in atrial fibrillation (AF) patients who has contraindications to anticoagulation. Old devices have a very good efficacy but has high rate of complications. Our study aims to compare one-year outcomes in older vs new devices as currently no large-scale comparative data is available.
Methods
Analysis was done with TriNetX US Network. Patients aged ≥18 years with AF/flutter who had percutaneous LAAO included in study. Two cohorts were made older (pre-2021) vs newer (post-2021). Patient who had open or extraluminal approaches were excluded. Outcomes include mortality, device thrombosis, antithrombotic use, GI bleeding, vascular, neurologic, pericardial complications were analyzed at day 30, 90, 180, and 365. Comparative analyses with measure of association and survival were performed after 1:1 propensity score matching (PSM).
Results
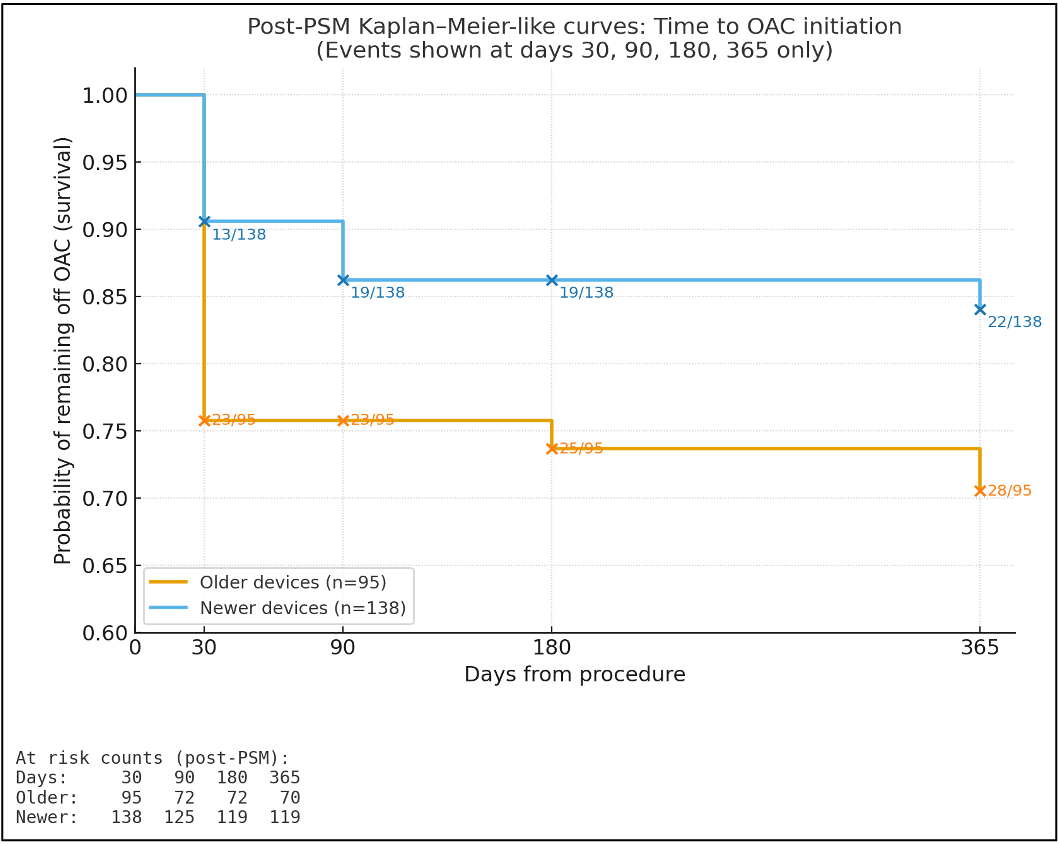
We got 7,360 patients in older era while 22,956 in the newer era. After PSM, we got 1065 patients in each group. Mortality was significantly lower in new group (0.9% vs. 2.4%, HR ~2.5, p=0.011) at day 90 but at day 30, 180 and 365 differences were not statistically significant. GI bleeding was high in older compared to new, 6.9% vs 4.4% (p=0.015; HR 1.57), 11.7% vs 9.2% (p=0.056; HR 1.30),17.8% vs 13.6% (p=0.047, HR 1.27), 17.8% vs 13.6% (p=0.007; HR 1.33) for Day 30, 90, 180, 365 respectively. Huge drop seen in oral anticoagulants at all timepoints from 30 to 365 days (RR 1.8–2.6; OR 2.0–3.1; HR 1.9–2.7), while antiplatelet therapy showed a difference only at day 30 (RR 1.5; OR 1.9; HR 1.6) but no changes after that. After PSM, device thrombosis, pericardial, neurologic and vascular complications rate was not statistically significant. TEE guided use has increased slightly compared to intracardiac echocardiography.
Conclusion
This large real-word analysis showed that new generation devices has significantly lower GI bleeding and mortality at some point compared to older one. Major paradigm shift seen in antithrombotic therapy with markedly reduce use in new era. These findings show the safety of newer devices in routine clinical practice in US population confirm benefits beyond the trials.
QI
Kavya Bana, MD1,2, Kristin Myers, BA3, Jack Bramley, MS4, Jan Schriefer, RN MBA MSN DrPH4, Meghan K. Train, DO1
1Department of Medicine, University of Rochester, Rochester, NY; 2Department of Pediatrics, University of Rochester, Rochester, NY; 3School of Medicine and Dentistry, University of Rochester, Rochester, NY; 4Quality Institute, University of Rochester, Rochester, NY
Background
In July 2021, our institution launched the Better Flow Program to improve patient throughput by documenting the Medically Ready for Discharge Date (MRDD) and the Discharge Delays (DDs) in the electronic medical record (EMR). The MRDD is the date at which a patient is deemed clinically stable for discharge by their medical team. The DDs describe the reasons why a patient remains in the hospital beyond the MRDD, for example, due to issues with skilled nursing facility placement.
We expanded upon our prior work to improve documentation of DDs by analyzing DD data through an equity lens. We hypothesized that those who were more socially vulnerable would have more DDs. Additionally, we wanted to identify DD types experienced by socially vulnerable patients to target interventions to improve disparities.
We utilized the Social Vulnerability Index (SVI), based on patient ZIP Code, to identify patients who are socially vulnerable. The SVI is an index developed by the CDC that quantifies a community’s vulnerability to natural and public health emergencies based on socioeconomic status, household characteristics, race & ethnic minority status, and housing type & transportation. SVI scores lie from 0-1, where higher scores indicate higher social vulnerability.
Smart-IE Aim
The aim of this project was to identify which DD types are experienced by the most socially vulnerable patients, defined by those with the highest SVI, on a 26-bed medical surgical unit from October 2023 to June 2025.
Methods
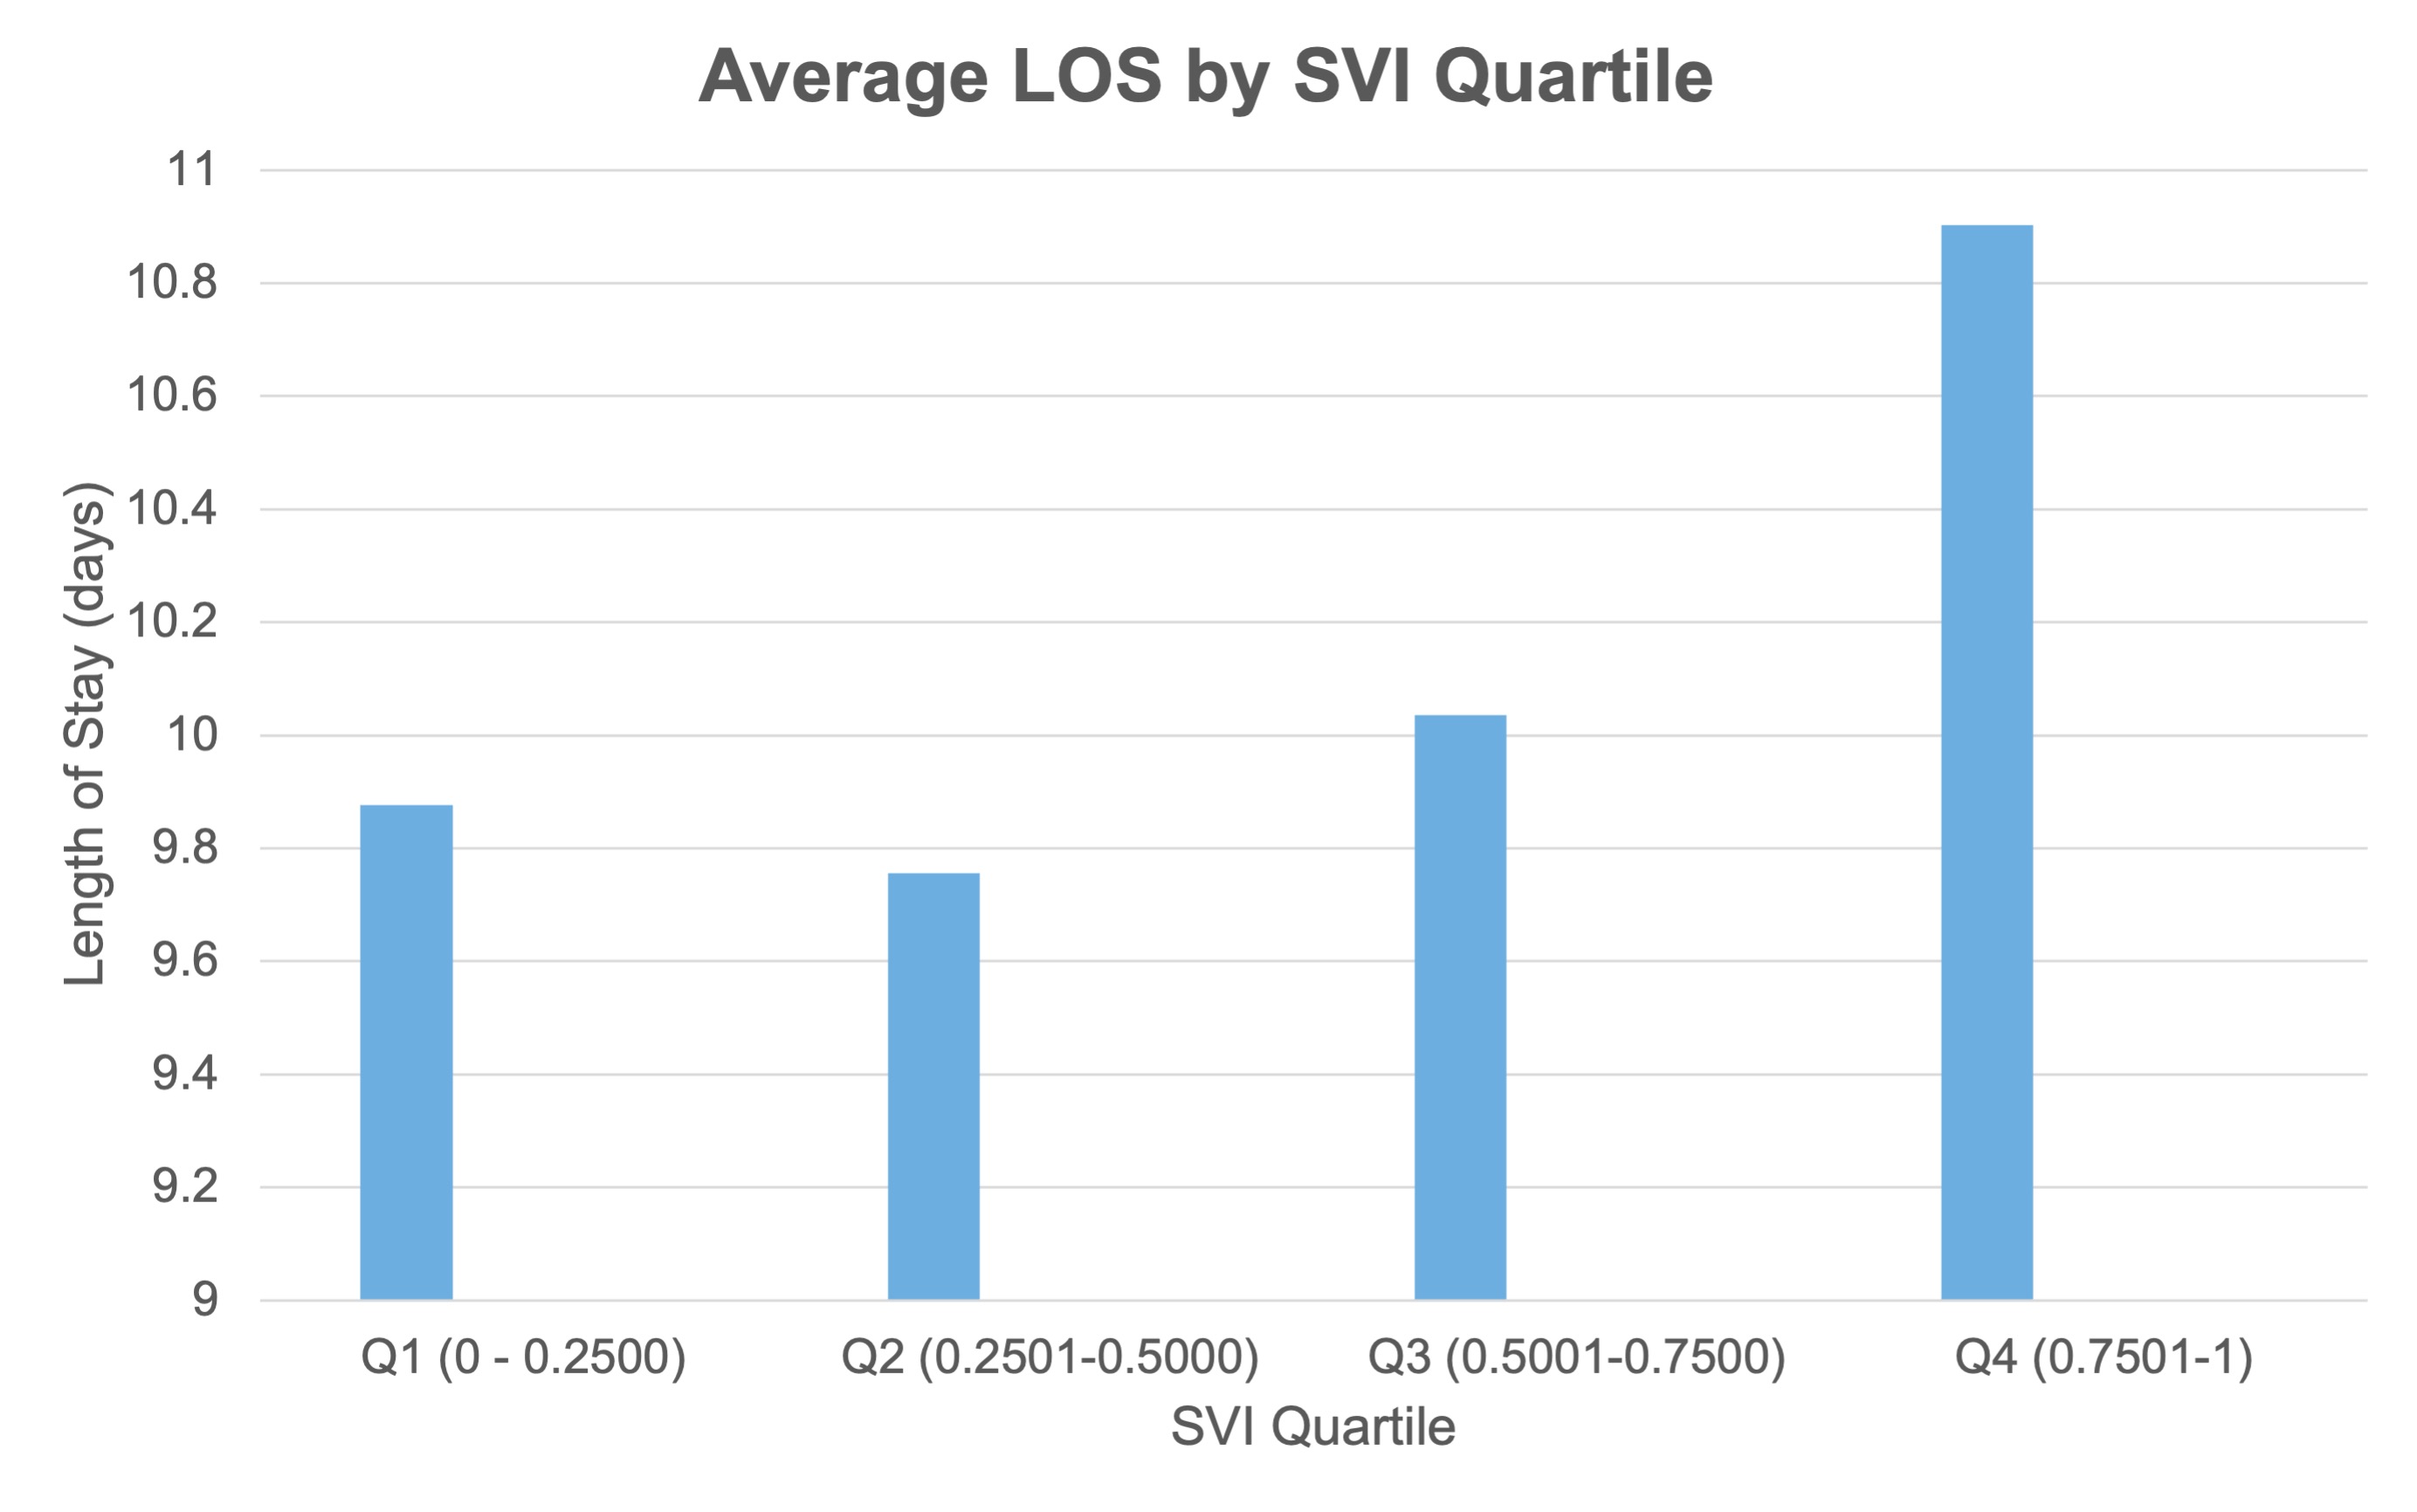
An interdisciplinary team continues to work on improving documentation of MRDD and DDs for patients. Data regarding DD types and LOS were obtained for 1859 patients discharged from the unit between October 2023 and June 2025. This data was then stratified by SVI quartile.

Socially vulnerable Patients were most affected by Discharge delays in consultations, home care coordination, and diagnostic imaging
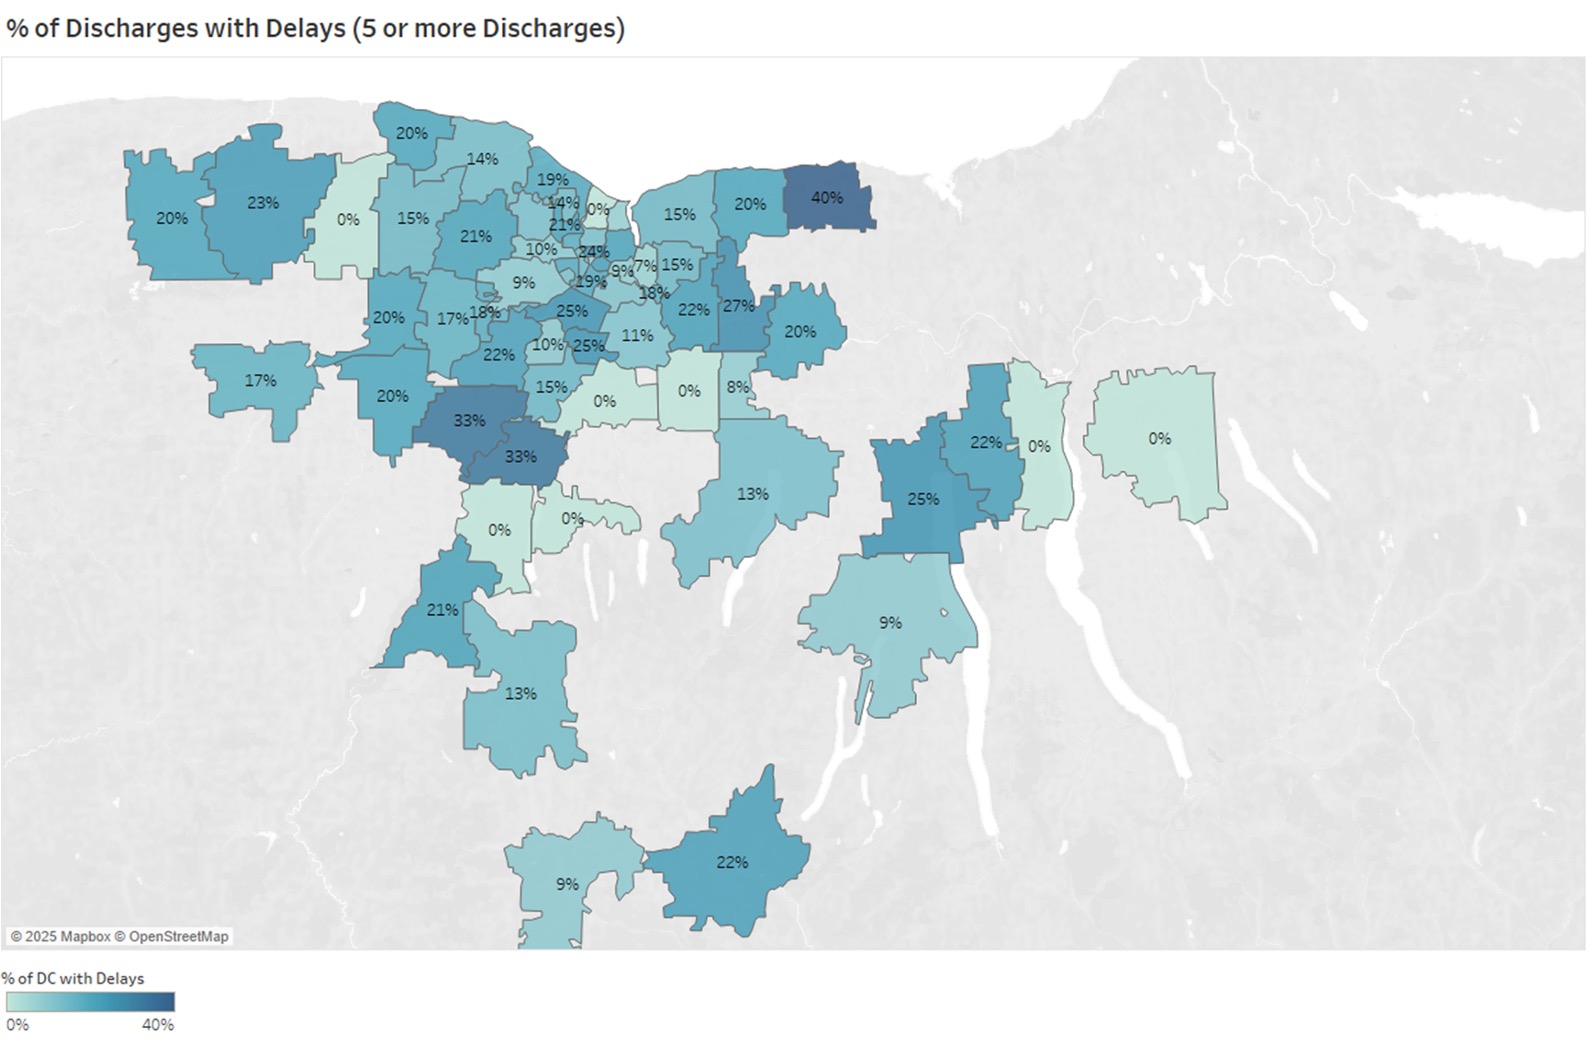

Results
In total 382 DDs were documented for the 1859 patients. 280 patients experienced at least one DD (15.06%). The mean SVI score for patients with a DD was 0.592, compared to 0.551 for patients without DDs. Fourth-quartile patients (SVI between 0.7500 and 1) experienced 133 of the total 382 DDs (34.8%). Overall, the top 5 DD types included Placement (143), Disposition (78), Consult (42), Home Coordination (27), and Diagnostic Imaging (24). Examining these five types, patients with a fourth-quartile SVI scores accounted for a disproportionate number of DDs in the types of Consult (40%), Home Coordination (52%), and Diagnostic Imaging (46%).
Discussion
Our analysis to date indicates DDs related to consultation services, home care coordination, and diagnostic imaging were more frequently recorded in more socially vulnerable patients. These findings were unexpected as our team had initially anticipated placement and disposition delays to be highest in most socially vulnerable patients when compared to less socially vulnerable patients.
There are limitations to the data including that for the 1859 patients, only 382 DDs were documented. There are likely many DDs that are not being documented. To address this issue, we have ongoing efforts to increase DD entry. These missing DDs may point to other areas to focus on to improve discharge for all patients, including those who are most socially vulnerable. Similarly, data collection efforts are ongoing and future data will increase population size and provide better generalizability. In the future, we could also consider comparing results from our 26-bed unit to others in the hospital.
Future Directions
To reduce length of stay and provide the best care for the most socially vulnerable patients, future projects may target complex discharge planning, including shifting specialty consults and imaging to outpatient settings when appropriate. These projects should also ensure that socially vulnerable patients can access the necessary wrap-around services (transportation, home support) to engage with post-hospital follow-up care.
Acknowledgments
- The Better Flow Team
- Dr. Keely Dwyer-Matzky
- Nicole Kaplan, UPP Coach
- Danielle Roman, RN
- Danielle Henry, Pharmacy
- Kara Vaughn, Care Coordinator
- Sarah West, Social Work
- Teresa Shannon, RN Manager
References
Meo N, Liao JM, Reddy A. Hospitalized After Medical Readiness for Discharge: A Multidisciplinary Quality Improvement Initiative to Identify Discharge Barriers in General Medicine Patients. American Journal of Medical Quality. 2020;35(1):23-28. doi:10.1177/1062860619846559
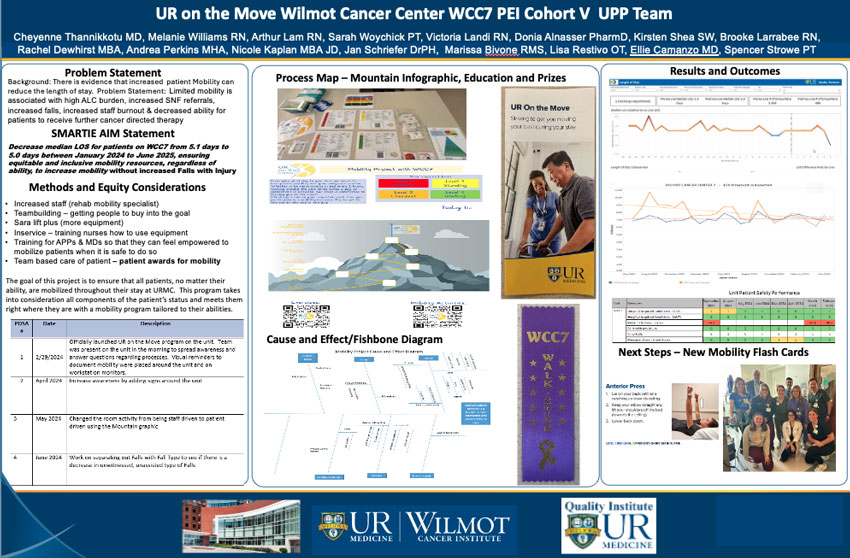
Cheyenne Thannikkotu MD, Melanie Williams RN, Arthur Lam RN, Sarah Woychick PT, Victoria Landi RN, Donia Alnasser PharmD, Kirsten Shea SW, Brooke Larrabee RN, Rachel Dewhirst MBA, Andrea Perkins MHA, Nicole Kaplan MBA JD, Jan Schriefer DrPH, Marissa Bivone RMS, Lisa Restivo OT, Ellie Camanzo MD, Spencer Strowe PT
University of Rochester Medical Center
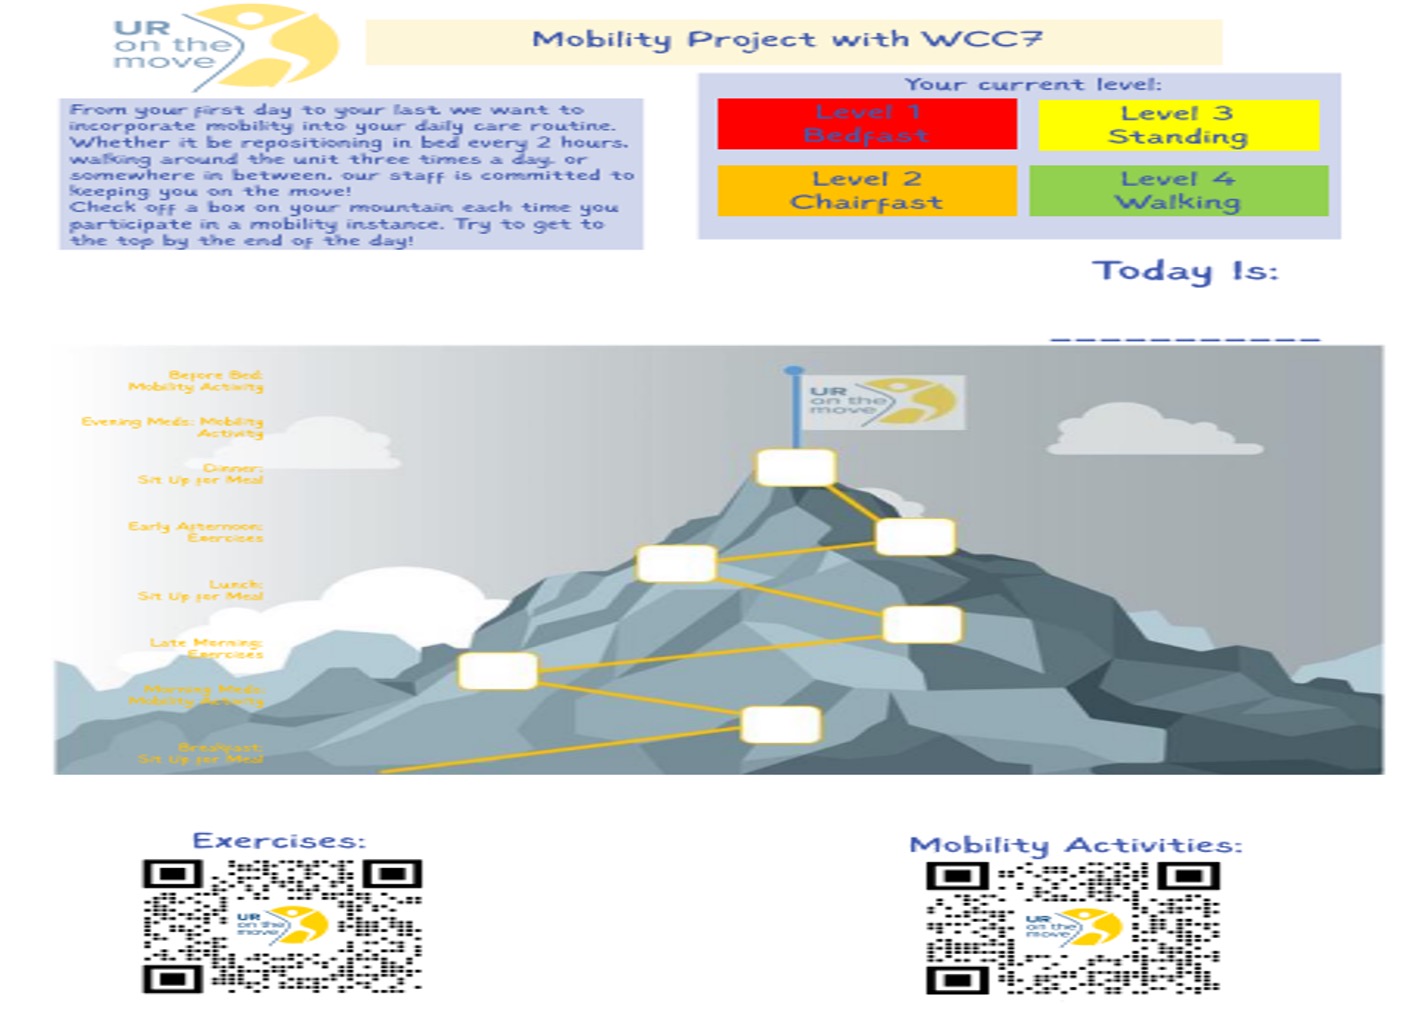
Problem Statement
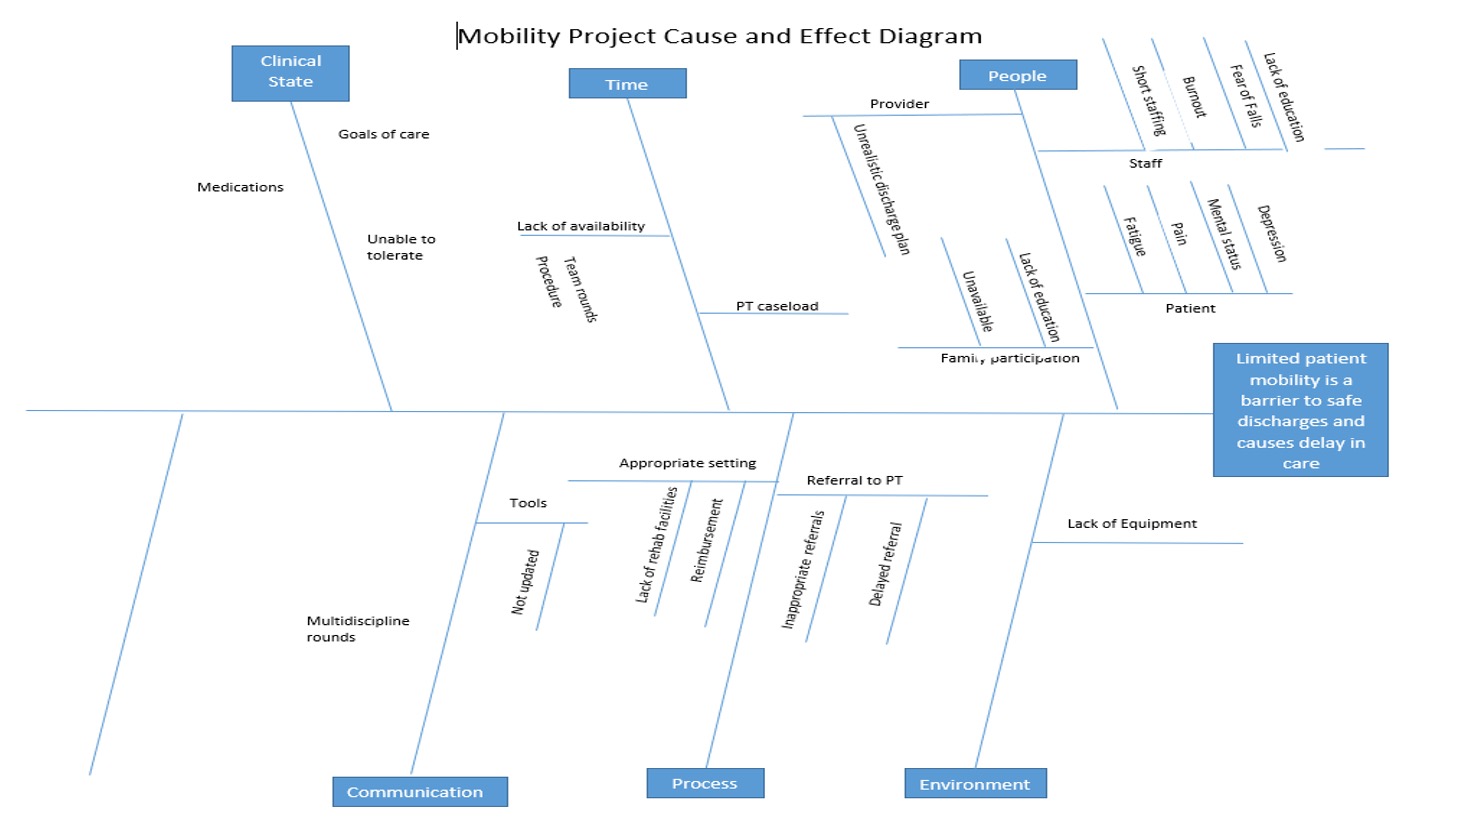
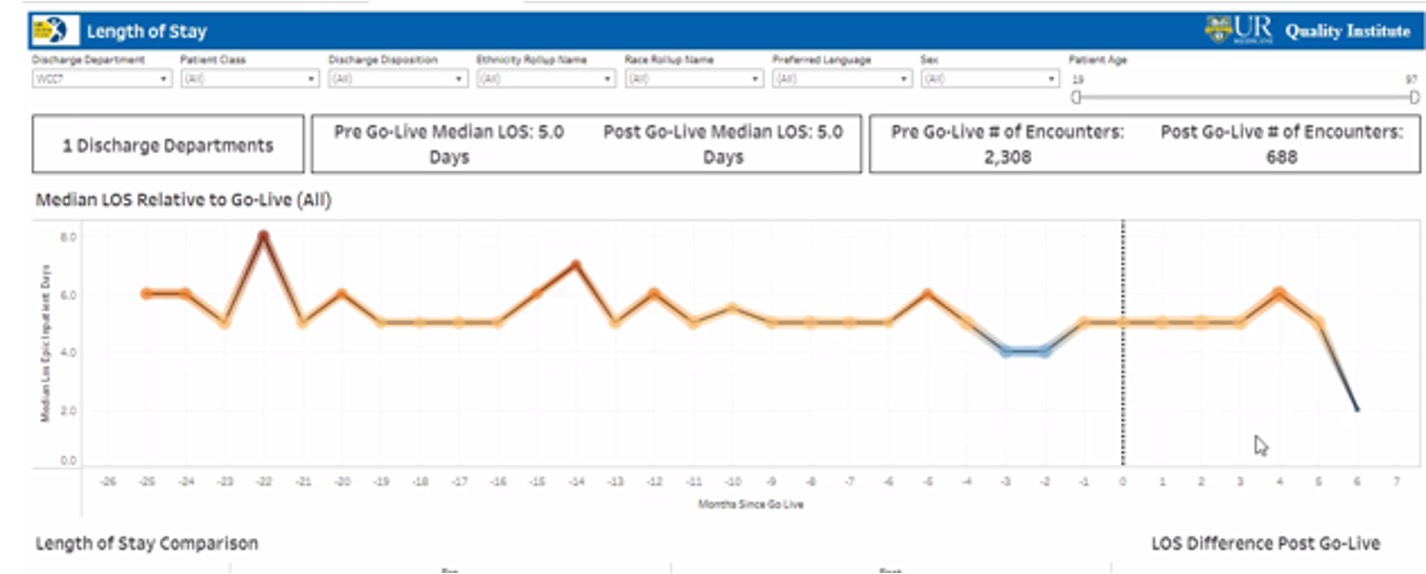
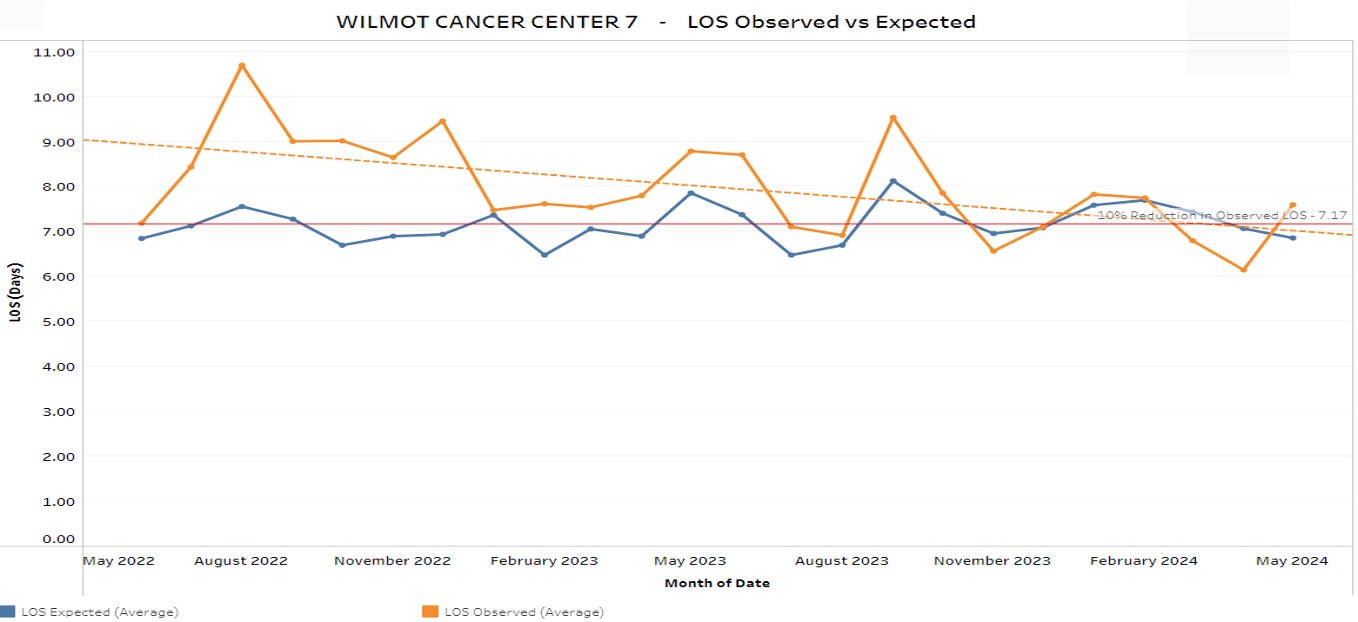
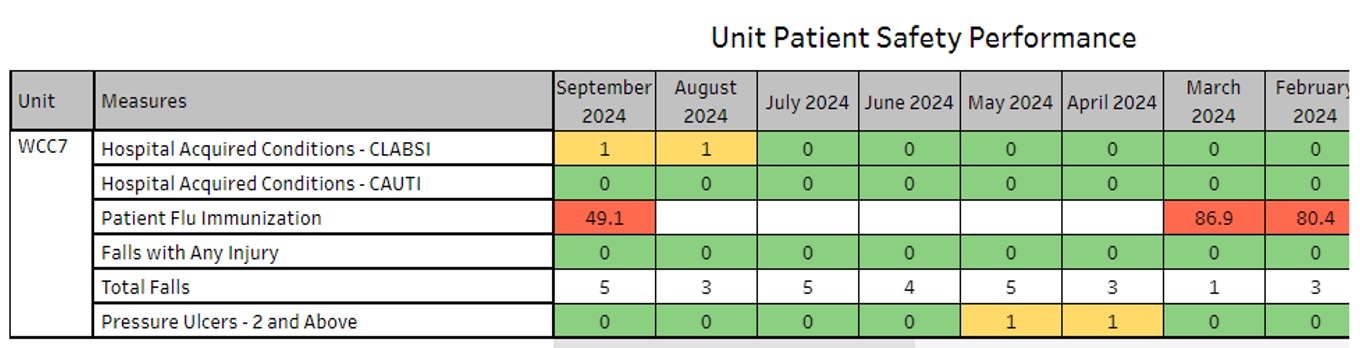
Background: There is evidence that increased patient Mobility can reduce the length of stay. Problem Statement: Limited mobility is associated with high ALC burden, increased SNF referrals, increased falls, increased staff burnout & decreased ability for patients to receive further cancer directed therapy.
SMARTIE AIM Statement
Decrease median LOS for patients on WCC7 from 5.1 days to 5.0 days between January 2024 to June 2025, ensuring equitable and inclusive mobility resources, regardless of ability, to increase mobility without increased Falls with Injury.
Methods and Equity Considerations
- Increased staff (rehab mobility specialist)
- Teambuilding—getting people to buy into the goal
- Sara lift plus (more equipment)
- Inservice—training nurses how to use equipment
- Training for APPs & MDs so that they can feel empowered to mobilize patients when it is safe to do so
- Team based care of patient—patient awards for mobility
The goal of this project is to ensure that all patients, no matter their ability, are mobilized throughout their stay at URMC. This program takes into consideration all components of the patient’s status and meets them right where they are with a mobility program tailored to their abilities.
| PDSA | Date | Description |
|---|---|---|
| 1 | 2/29/2024 | Officially launched UR on the Move program on the unity. Team was present on the unit in the morning to spread awareness and answer questions regarding processes. Visual reminders to document mobility were placed around the unit and on workstation monitors. |
| 2 | April 2024 | Increase awareness by adding signs around the unit |
| 3 | May 2024 | Changed the room activity from being staff driven to patient driven using the Mountain graphic |
| 4 | June 2024 | Work on separating out Falls with Fall Type to see if there is a decrease in unwitnessed, unassisted type of Falls |
Process Map—Mountain Infographic, Education and Prizes

Cause and Effect/Fishbone Diagram


Results and Outcomes
Next Steps—New Mobility Flash Cards

Filloux, C.M.; Corvelli, J.M.; Roto, D.
University of Rochester, Rochester, NY
Background
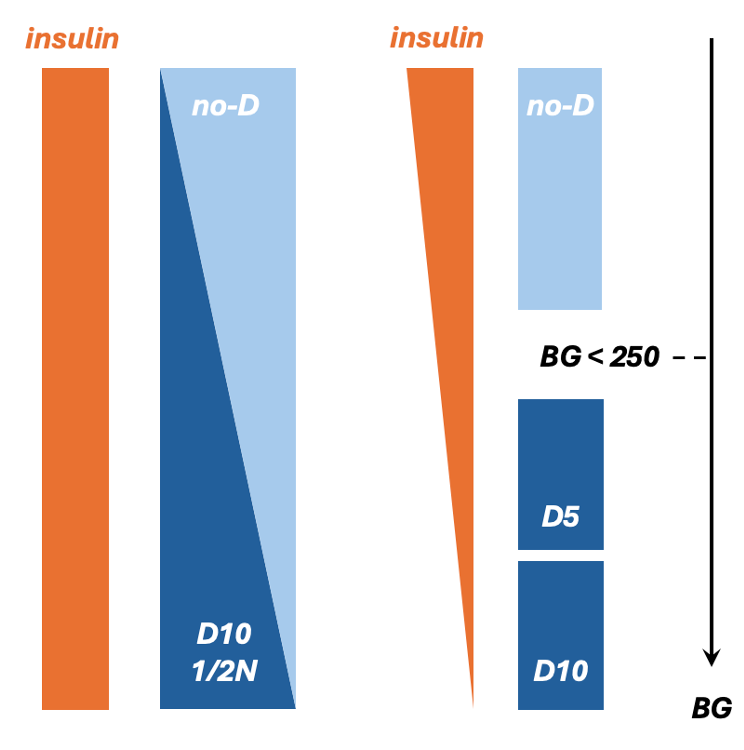
Diabetic Ketoacidosis (DKA) is diabetic emergency characterized by relative or absolute insulin deficiency leading to a perceived starvation state. At URMC, DKA is treated in a protocolized fashion in the medical ICU. We recently modified URMC’s DKA protocol from a one-bag protocol to a two-bag protocol (Figure 1, left), as it has yielded improved safety and resource outcomes at other institutions. Our QI project seeks to compare outcomes of the one- and two-bag protocols at URMC (Figure 1, right). As a process measure toward this goal, we sought to improve resident understanding of DKA diagnosis and protocol utilization through a noon education session.
Future work will compare outcomes of one- and two-bag protocols.
Primary Outcome Measures
- Time to gap closure
Secondary Outcome Measures
- Time to diet
- Time in ICU
- Readmission to ICU
- Hospital LOS
- Incidence of Hypokalemia
- Incidence of hypoglycemia
Figure 1. In the two-bag* (current) protocol, dextrose is titrated to POCT glucose (BG) while insulin is infused at a fixed rate. In the one-bag* (old) protocol, insulin is titrated to BG. The two-bag protocol has the advantage of rapidly correcting insulin deficit while reducing nursing burden (insulin titration requires a two-nurse sign off) and improving generalizability (e.g. EDKA) by decoupling insulin dose from BG. *Two-bag and one-bag refer to number of fluid bags connected to a patient at any given time.
Current Work—Methods
- Education about DKA diagnosis and protocolized management was provided to senior residents (session 1) and interns (session 2) via PPT presentation during 45-minute lunch education sessions.
- A pre-lecture Red-cap survey was administered prior to lecture to all attendees to gauge perceived and demonstrated understanding of DKA diagnosis and management.
- A post-lecture Red-cap survey was administered immediately following the lecture to all attendees to gauge perceived and demonstrated understanding of DKA diagnosis and management.
- Pre- and post-lecture survey results were downloaded from Red-cap and analyzed via excel (Figure 2 – 4, right).
Results
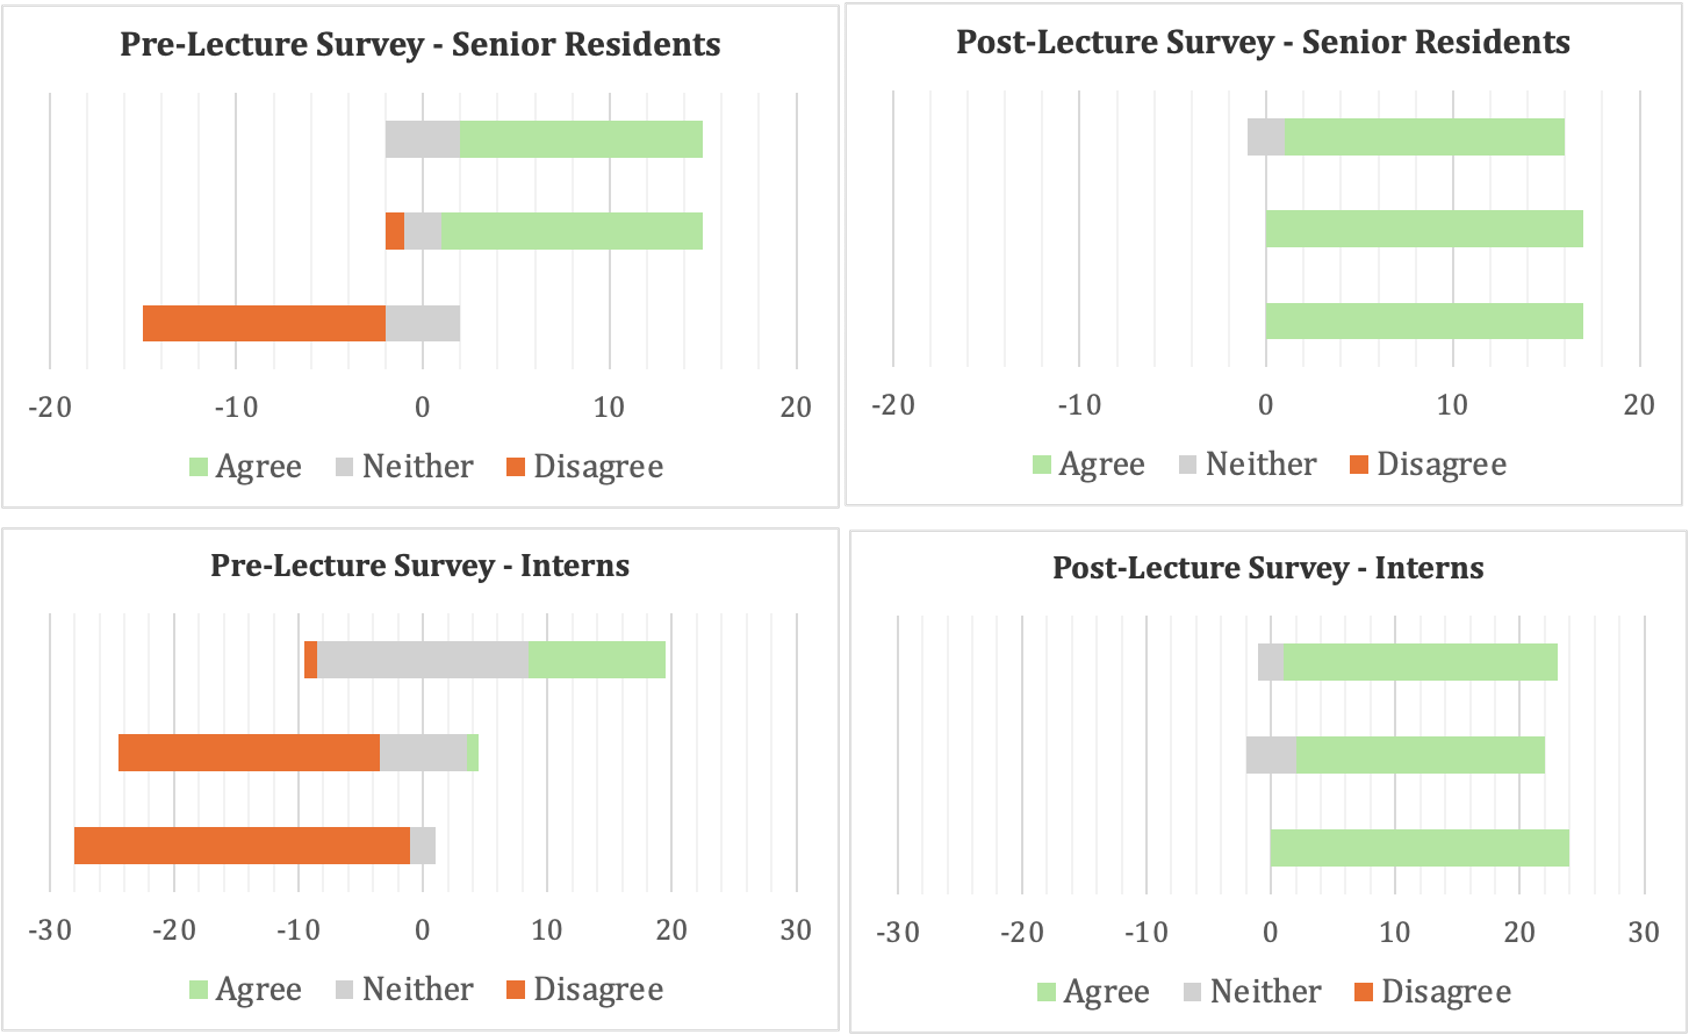
Figure 2. Likert Scale of pre-lecture (left) and post-lecture (right) survey responses to each of 3 statements by senior residents (top) and interns (below). Statement 1: I know how to diagnose DKA; 2) I know how the current (one-bag) ICU DKA protocol works; 3) I know how a two-bag DKA protocol differs from a one-bag DKA protocol.
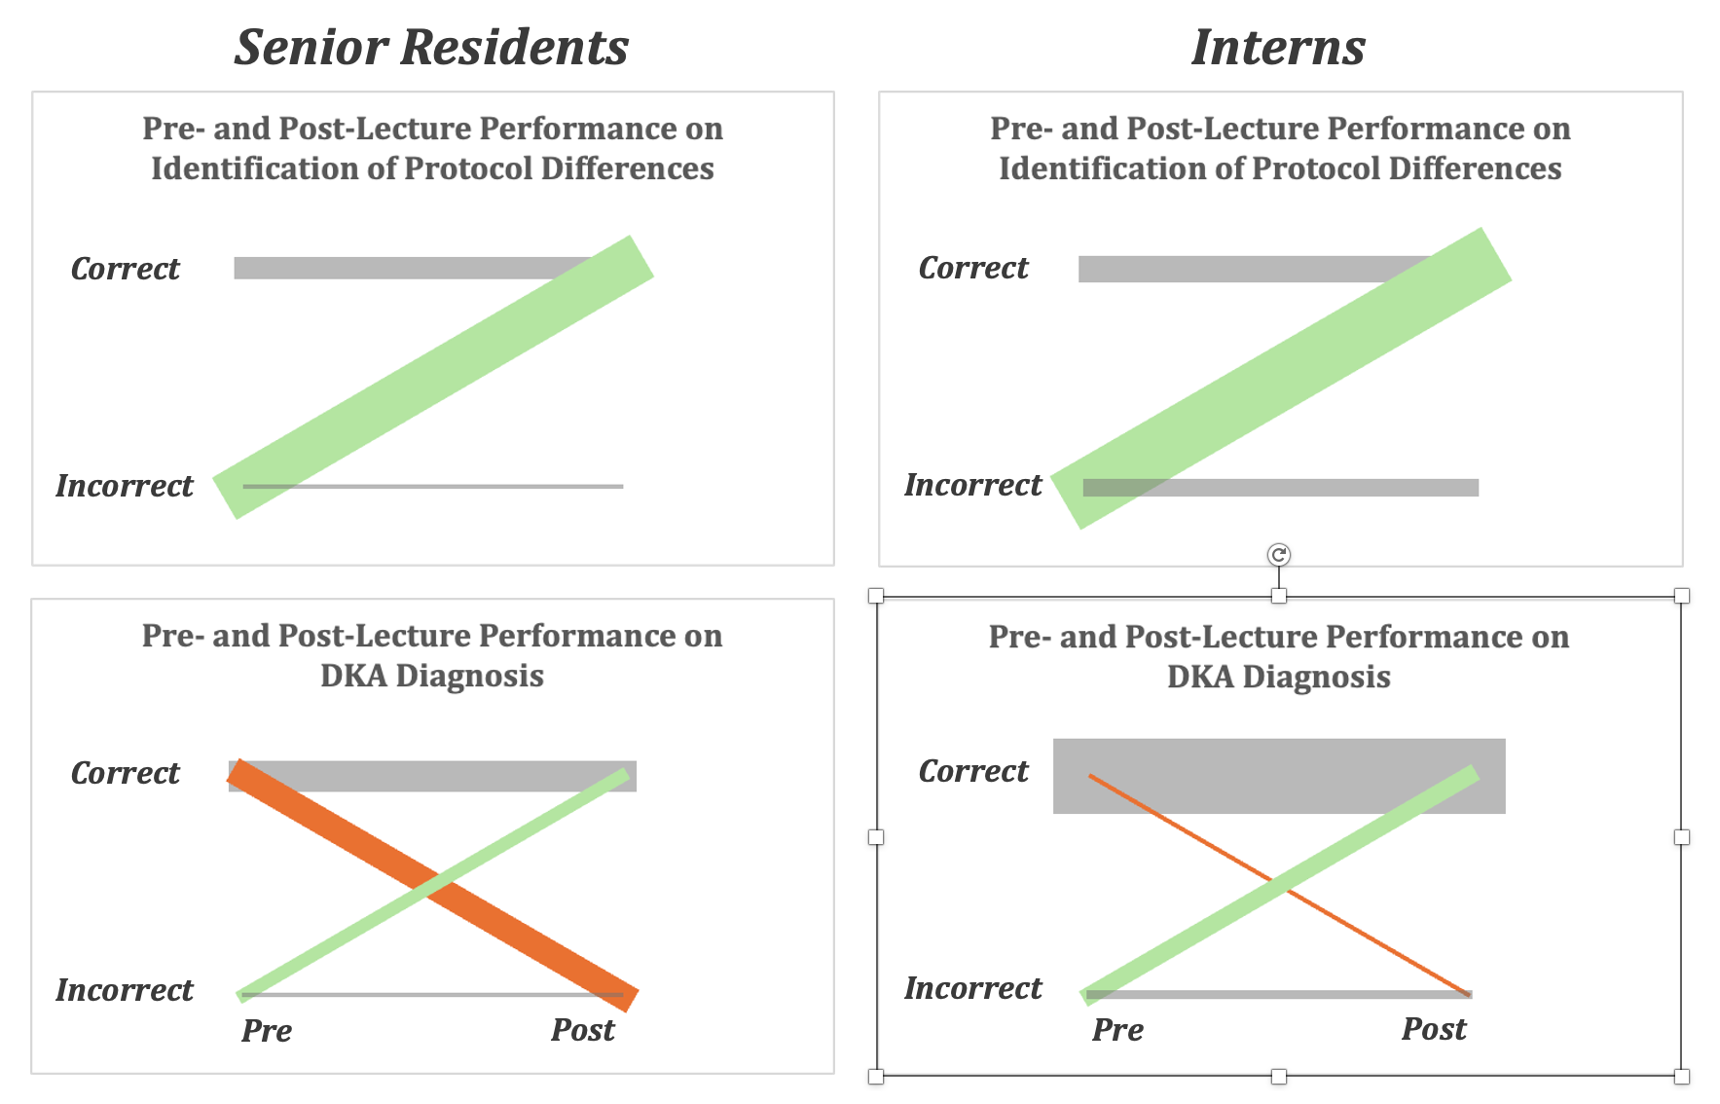
Figure 3. Weighted slope charts showing pre- and post-lecture performance of senior residents (left) and interns (right) on multiple choice questions (Figure 4) assessing competency in protocol differentiation (one- vs. two-bag, top) and DKA diagnosis (bottom). In each chart, pre-lecture data is plotted on the left; post-lecture data is on the right; correct responses are on top; incorrect responses are on bottom. Each chart contains up to four lines representing one of four learning outcomes: green = positive outcome (e.g. incorrect to correct); orange = negative outcome (correct to incorrect); grey = neutral outcome (correct to correct and incorrect to incorrect). Analysis of a surprising negative learning outcome for senior residents in bottom left of Figure 3 (asterisk) led to the hypothesis that seniors had answered the post-test question assuming it was identical to the pre-test question (see asterisk, Figure 4). In a subsequent session with interns, the post-lecture question was preceded by a bolded warning that pre- and post-lecture questions were different, and a net-positive learning outcome was achieved.
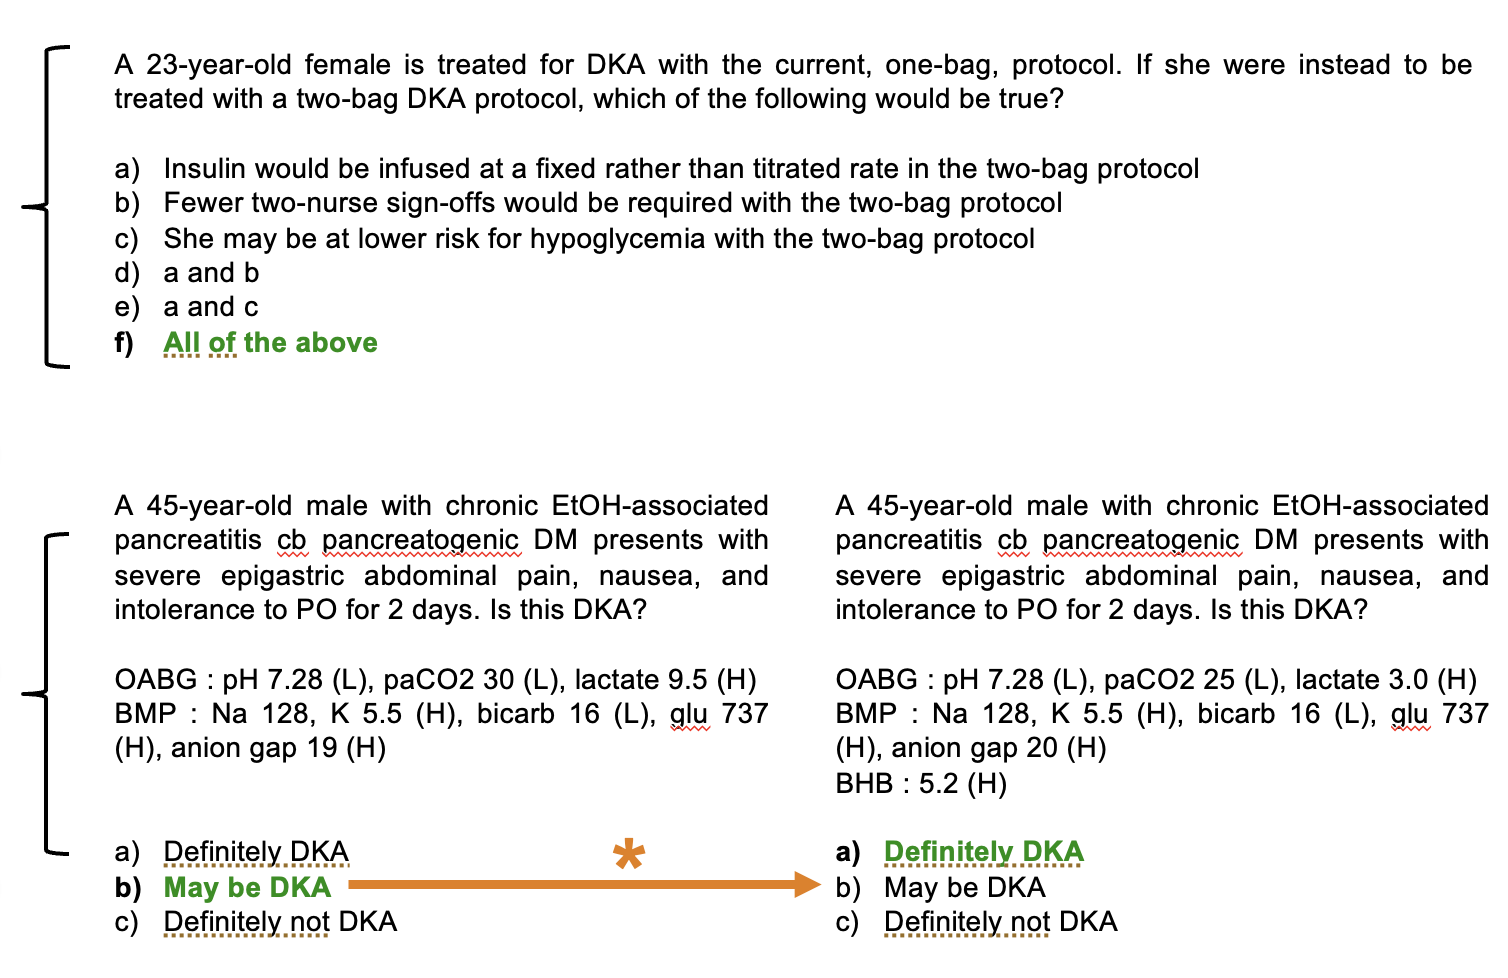
Figure 4. Pre- and post-lecture questions used to assess competency in protocol differentiation (top) and DKA diagnosis (bottom). Figure 3 shows slope graphs of intern and resident responses to these questions. Top: pre- and post-test assessment of protocol differentiation (pre- and post-lecture questions are the same). Correct answer is E.
Bottom Left: pre-test question assessing DKA diagnosis. Correct answer is B.
Bottom Right: post-test question assessing DKA diagnosis. Correct answer is A. In intern post-lecture test ONLY the post-lecture question was preceded by this statement: “THIS IS NOT THE SAME QUESTION FROM THE PRETEST.”
The orange arrow represents the orange slope in Figure 3 noted by asterisk.
Conclusions
Interns and residents at URMC demonstrate improved subjective and objective competency in DKA diagnosis and treatment-protocol understanding after a brief educational intervention.
The authors have no disclosures
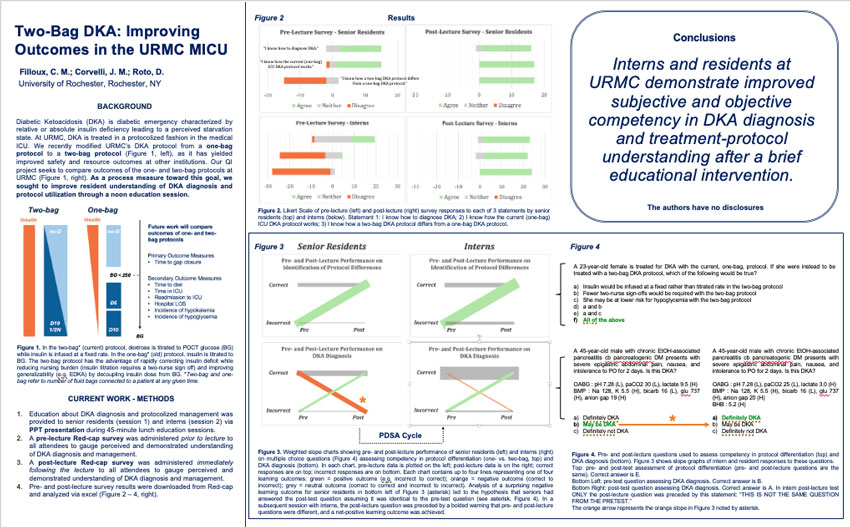
Paul Hart MD, Joseph Abiade MD, George Ashji, Richa Patel, Andrew Mathias MD
University of Rochester Medical Center
Introduction
- The ACC/AHA guidelines for evaluation and diagnosis of chest pain released in 2021 incorporated risk stratification of patients using one-hour high sensitivity troponin (hs-cTn) 1.
- The University of Rochester Medical Center implemented this pathway in early 2022 to improve risk stratification, diagnosis, treatment, and facilitate earlier discharge of low risk patients.
- The effects of this implementation have significant consequences on cost and value of care at URMC through intended and unintended impacts.
- Quality improvement analysis of the implementation of this program can provide important information to ensure that patients at URMC receive the highest value care possible.
Methods
- A retrospective database of all patient encounters for chest pain based on ICD code criteria from 2018 to 2024 was created for quality assurance analysis (N=48,048).
- Patient encounters with complete 0-hour and 3-hour troponin data were included for analysis of troponin utilization (N=31409).
- Patient encounters with complete admission and discharge time data were included for analysis of rate of early discharge (N=23,229).
- Patient encounters with complete 0-hour, 1-hour, and 3-hour troponin data were included for analysis of chest pain pathway risk stratification and other outcomes (N=1923).
- Patient encounters with incomplete data for discharge and admission times, 0-hour, 1-hour, or 3-hour troponin values, were excluded from our analysis.
- Change over time was calculated using year over year average percent change.
Results
- The volume of 3-hour troponin draws decreased by an average of 3.5% per year among encounters analyzed, and decreased more sharply after implementation in 2022 (Figure 1).
- The overall rate of patients discharged early (< 6 hours) rose by an average of 4.5% per year since implementation of the new chest pain pathway at URMC in 2022 (Figure 2).
- The rate of 3 hour low risk patients discharged decreased slightly by an average of 3.9% per year since implementation, while the rate of intermediate 3 hour risk patients rose since 2022 by an average of 7.9% per year (Figure 3).

Figure 1. Yearly volume of 3-hour troponin draws vs number of yearly 0-hour troponin draws.

Figure 2. Number of chest pain encounter patients discharged early (< 6 hours) vs patients discharged not discharged early.

Figure 3. Number of patients discharged early (< 6 hours) by 3-hour troponin risk status.
Conclusions
- There was a slight decrease in the number of 3 hour troponin draws after implementation of the new one hour pathway
- Patients were discharged early at similar rates as compared to prior to implementation of the new chest pain pathway, though there sems to be a slight improvement in early discharge rates overall which may be due to improved stratification of intermediate risk patients
- Implementation of this pathway did not appear to have any negative impacts on rate of early discharge, and may have improved rates of lab utilization for 3 hour hs-cTn.
Limitations
- Analysis limited by incomplete troponin data for certain encounters which may skew trends of overall utilization
- Comparison data from prior to implementation in 2022 limited due to database collection methods
References
- Gulati, Martha et al. “2021 AHA/ACC/ASE/CHEST/SAEM/SCCT/SCMR Guideline for the Evaluation and Diagnosis of Chest Pain: A Report of the American College of Cardiology/American Heart Association Joint Committee on Clinical Practice Guidelines.” Circulation vol. 144,22 (2021): e368-e454. doi:10.1161/CIR.0000000000001029

Marwa Hussain MD, Jennifer Pascoe MD, FHM
Department of Medicine, University of Rochester Medical Center
Background
Medical students have varying amounts of exposure to Electronic Medical Records (EMR) prior to starting clinical clerkships. The variability in experiences creates differing levels of preparation for transitioning to clinical medicine.
Aim
To increase clerkship students’ knowledge of EMR navigation and preparation for clerkship by 25% over the next academic year
Innovations
Developed an interactive workshop teaching key features of EMR with the goal of minimizing inefficiencies and prioritizing patient safety during transitions of care.
- locating and managing patient lists
- standardized approaches to chart review
- accurate electronic handoffs
- completion of discharge instructions
- medication reconciliations
Results
6 workshops delivered over a 1-hour session for each internal medicine clerkship block. 2 sessions completed to date. Outcomes assessed via survey: attitudes toward level of preparedness, knowledge of how to navigate EMR, and top learning resources
Pre and Post Intervention
(Academic Years '24-'25 – current)

Conclusion
We developed an interactive workshop focused on reducing inefficiencies in EMR use for internal medicine clerkship students. Students reported increased satisfaction with preparation for the clerkship. Remaining 4 sessions will be completed and evaluated for continued PDSA cycles for academic year ‘26-’27.
References
- Inpatient Provider Exercises. Epic, URMC, eRecord, 3/28/25
- Osborne C, Pascoe J, Salib E. How to Succeed in the Internal Medicine Clerkship. June 2024.

Monica Masterson, MD, Charles Leahy, MD and Andrew Mathias, MD
University of Rochester Medical Center
Introduction
The hospital discharge summary is our primary method used to communicate a patient's plan of care to the next provider. Many guidelines exist outlining the optimal content for the discharge summary to facilitate an effective transition to posthospital care. Electronic medical records are used to create a template on which standardization of content and format can be implemented. For this quality improvement project, we have designed and implemented a standardized discharge summary for patient discharges at the URMC Heart Center.
Objective
To improve care transitions, we intend to explore primary care physicians (PCPs) and outpatient cardiology perspectives on characteristics of high-quality discharge summaries.
Methodology
Plan:
Optimize the standardized discharge summary in the Heart Center
Do:
Survey primary care physicians (PCPs) and outpatient cardiology perspectives on characteristics of high-quality discharge summaries
Study:
Review of survey results
Act:
Implement changes to the standardized discharge summary based on survey results
Results
Heart Center Discharge Summary Survey
- What is your role?
Figure 1. Care Role. Counts/frequency: PCP (26, 72.2%), Cardiologist (8, 22.2%), Resident or fellow (2, 5.6%), Hospital-based APP (0, 0.0%), Other (0, 0.0%) - The hospital narrative should be concise rather than comprehensive and detailed.
Figure 2. Discharge length preference. Counts/frequency: 1 - Disagree Strongly (2, 5.6%), 2 - Disagree (2, 5.6%), 3 - Neutral (2, 5.6%), 4 - Agree (16, 44.4%), 5 - Agree Strongly (14, 38.9%) - I prefer the medication list to only highlight changes (stopped, dose change, or started)
Figure 3. Medication list changes. Counts/frequency: 1 - Disagree Strongly (4, 11.1%), 2 - Disagree (9, 25.0%), 3 - Neutral (6, 16.7%), 4 - Agree (9, 25.0%), 5 - Agree Strongly (8, 22.2%) - I prefer seeing a full list of all medications
Figure 4. Full med list. Counts/frequency: 1 - Disagree Strongly (0, 0.0%), 2 - Disagree (8, 22.2%), 3 - Neutral (5, 13.9%), 4 - Agree (13, 36.1%), 5 - Agree Strongly (10, 27.8%) - How important is including the outpatient follow-up appointments component of the DC summary?
Figure 5. Outpatient Follow-up. Counts/frequency: 1 - Very Unimportant (3, 8.3%), 2 - Somewhat Unimportant (2, 5.6%), 3 - Neutral (2, 5.6%), 4 - Somewhat Important (5, 13.9%), 5 - Very Important (24, 66.7%) - How important is the cardiac testing component of the DC summary?
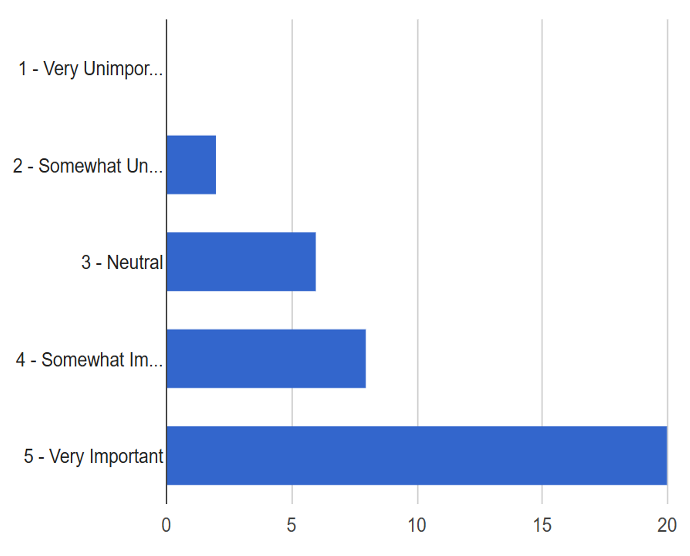
Figure 6. Cardiac Testing. Counts/frequency: 1 - Very Unimportant (0, 0.0%), 2 - Somewhat Unimportant (2, 5.6%), 3 - Neutral (6, 16.7%), 4 - Somewhat Important (8, 22.2%), 5 - Very Important (20, 55.6%) - How important is the non-cardiac additional imaging component of the DC summary?
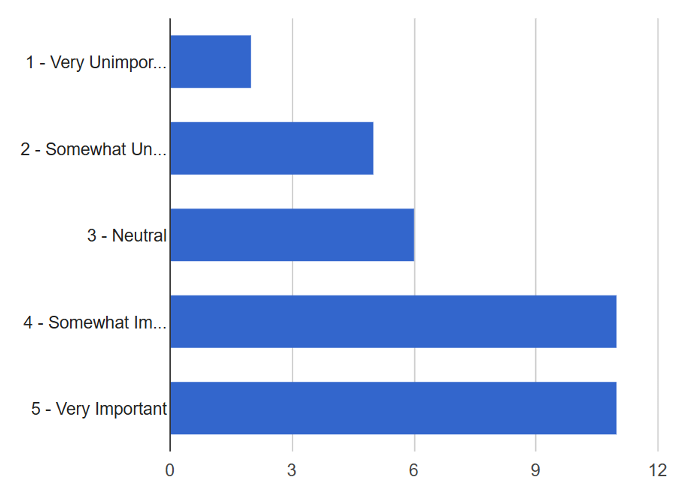
Figure 7. Other Imaging. Counts/frequency: 1 - Very Unimportant (2, 5.7%), 2 - Somewhat Unimportant (5, 14.3%), 3 - Neutral (6, 17.1%), 4 - Somewhat Important (11, 31.4%), 5 - Very Important (11, 31.4%) - If you have received the attached DCS template, how satisfied were you with it?
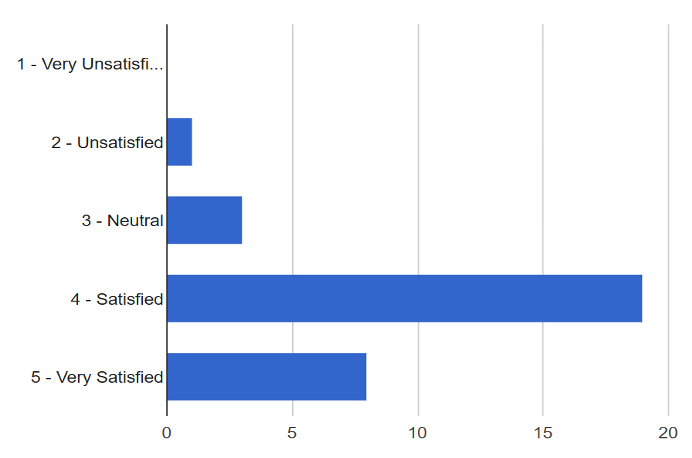
Figure 8. Discharge Summary Satisfaction. Counts/frequency: 1 - Very Unsatisfied (0, 0.0%), 2 - Unsatisfied (1, 3.2%), 3 - Neutral (3, 9.7%), 4 - Satisfied (19, 61.3%), 5 - Very Satisfied (8, 25.8%) - All discharge summaries should utilize a standardized template.
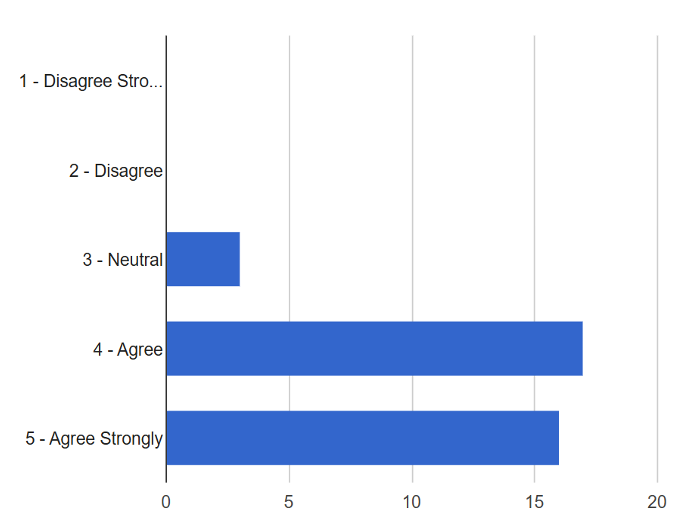
Figure 9. Standardized Template. Counts/frequency: 1 - Disagree Strongly (0, 0.0%), 2 - Disagree (0, 0.0%), 3 - Neutral (3, 8.3%), 4 - Agree (17, 47.2%), 5 - Agree Strongly (16, 44.4%)
Discussion
- There was a stronger preference for a brief hospital narrative
- There was a stronger preference for including full medication list
- All follow-up visits were suggested to be included
- All types of imaging were suggested to be included
- There was a preference for utilizing standardized discharge templates
- Responses did not differ significantly between primary care and cardiology
Quality Improvement Interventions
- A section dedicated to outpatient follow-up visits was added to the discharge summary
- A section to include a full medication list was added to the discharge summary
- A standardized hospital course summary was created to encourage conciseness
Conclusions
- We designed and implemented a standardized discharge summary for patient discharges at the URMC Heart Center. To better optimize the discharge summary, we surveyed primary care physicians (PCPs) and outpatient cardiologists’ perspectives on the current discharge template and implemented changes to the summary based on feedback received from the survey.
- There has been reported improvement in care transitions between the hospital and posthospital settings with implantation of a standardized discharge template. This encourages the use of standardized discharge templates in other areas of the hospital.
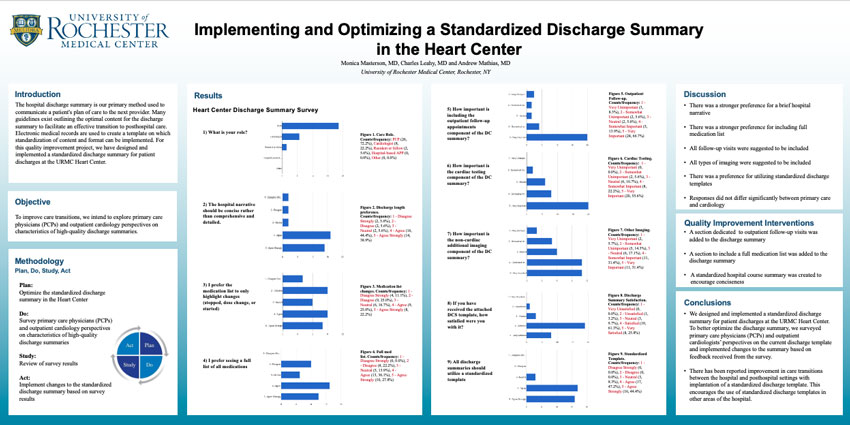
Rebecca Lee, M.D., Darla Carvallo Castaneda, M.D., Ulyana Khaba, M.D., Clare Park, D.O.
Department of Medicine, University of Rochester, Rochester, NY
Background
Congestive heart failure exacerbation (CHFe) is a common diagnosis leading to– or complicating– inpatient admissions, prolonging length of stay (LOS) and causing high readmission rates. The mainstay of inpatient CHFe treatment is intravenous diuretic therapy.
ENACT-HF trial was a multicenter 2-phase trial (standard care vs protocol) with >400 participants which demonstrated that utilization of a standardized natriuresis-guided diuretic protocol to guide decongestion in CHFe was feasible, safe, and resulted in higher natriuresis and diuresis as well as reduced LOS.
Our hospitalists do not follow strict guidelines or protocols when making decisions regarding the diuretic dosing for CHFe, with a high degree of variability in individual providers’ practice. Devising an order set to implement a natriuresis-guided diuretic protocol may ultimately improve our institutional CHF outcomes, as seen in the ENACT-HF trial.
SMARTIE Aim
SMH HMD will increase utilization of an evidence-based natriuresis protocol from 0% to 90% of acute CHF admissions by the end of 2026, enacted equitably across all demographics.
Methods
Through incorporation of the ENACT-HF trial literature and collaboration amongst interdisciplinary teams consisting of HMD faculty, residents, APPs, cardiology faculty, pharmacists and med/surg unit nurses, the acute CHF protocol, including an order set in the electronic medical records was devised. We launched and started utilizing the acute CHF protocol/order set for inpatient care on July 22nd 2025.
Results & Discussion
Since its implementation, two patients with CHFe received diuretic dosing according to our Acute CHF Protocol. The first patient had a history of HFpEF and developed acutely decompensated heart failure during admission for sepsis, while the second was a new diagnosis of HFpEF. In both cases, a spot urinary sodium was obtained, though later than intended (5–6 hours after loop diuretic administration rather than the recommended 1–2 hours). Urine output was documented at 0 and 6 hours for one patient, but not for the other, highlighting early challenges with protocol adherence. Despite these operational issues, both patients demonstrated stable renal function throughout the protocol (creatinine 2.0 → 2.15 mg/dL and 2.59 → 2.86 mg/dL). Importantly, in the first case, the protocol provided a structured framework for diuretic selection and dosing, minimizing provider variability and establishing a more consistent therapeutic approach.
CHF exacerbation is one of the most common diagnoses for inpatient admissions, and the implementation of a natriuresis-guided diuretic protocol could improve patient outcomes.
Inclusion Criteria
- Diagnosis: Acutely decompensated HF*
- Clinical findings: Volume overload
- Peripheral edema, pulmonary edema, ascites and/or pleural effusion
- If no established history of CHF, suggest NT-pro-BNP ≥1000
*Recommend Cardiology consult if LVEF < 20
Exclusion Criteria
- BP: SBP < 90 mmHg or concern for cardiogenic shock
- Renal function: Need for renal replacement therapy (acute or chronic)
- Known allergy to loop diuretics
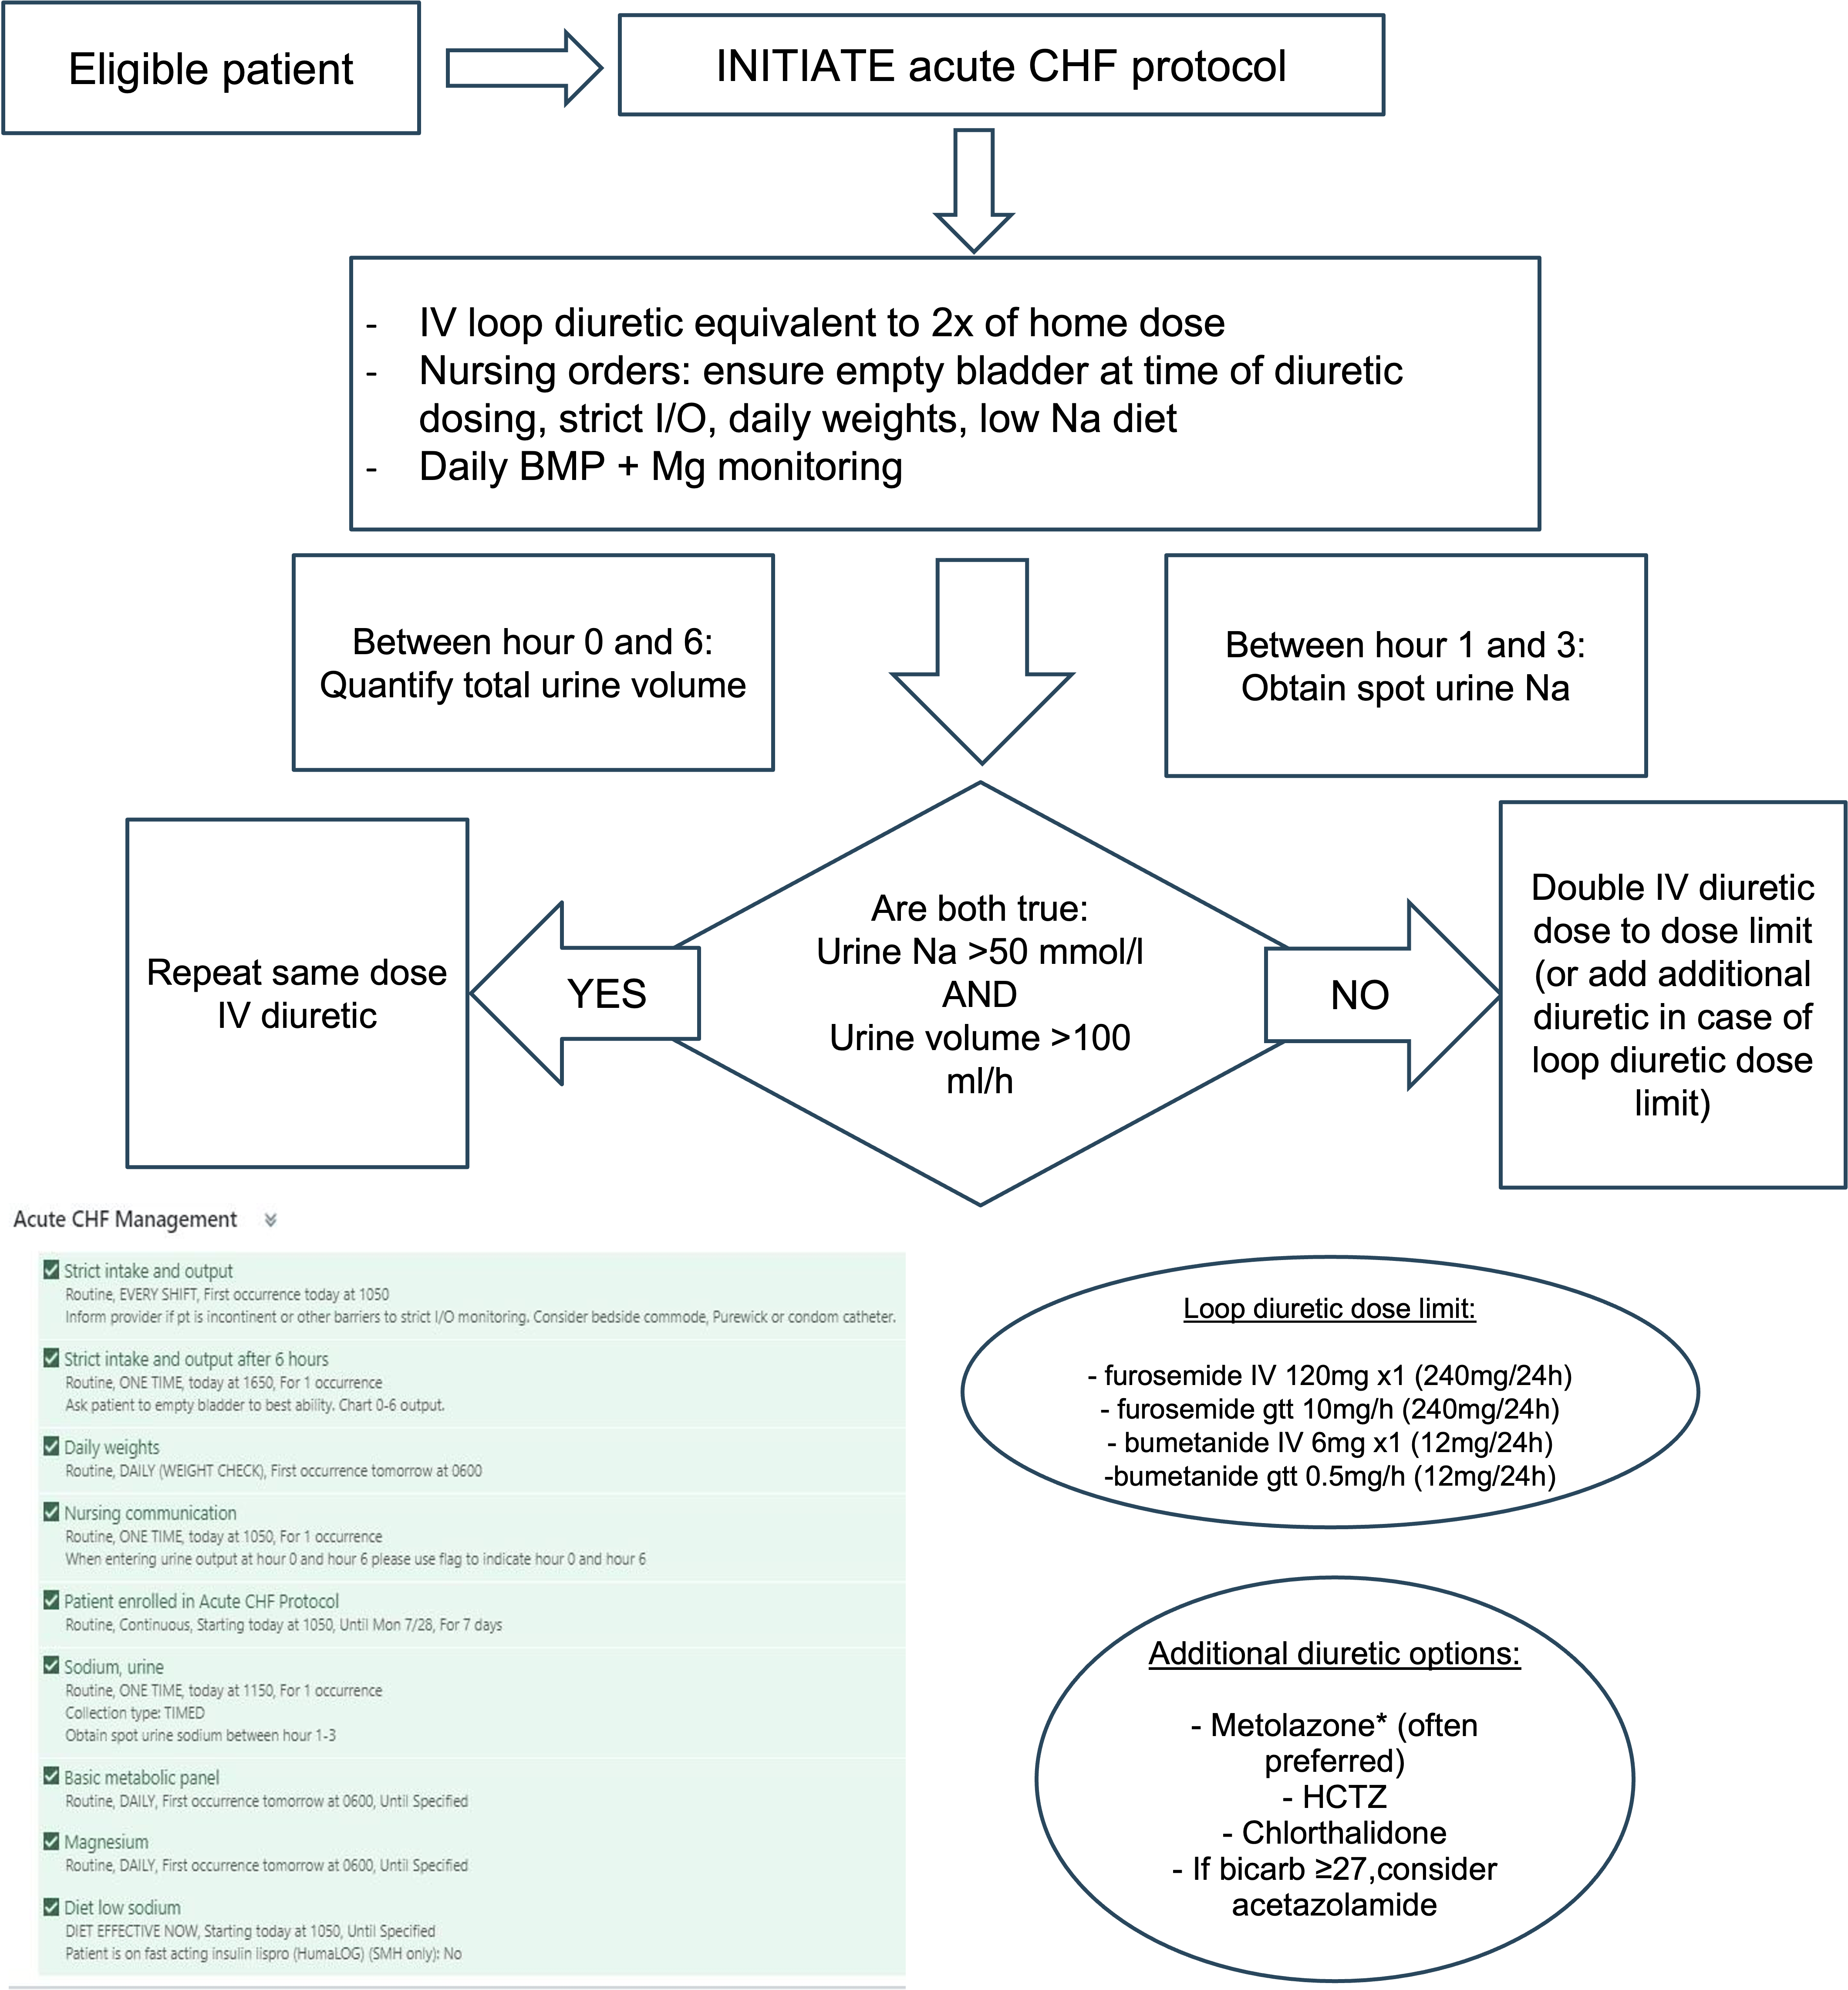
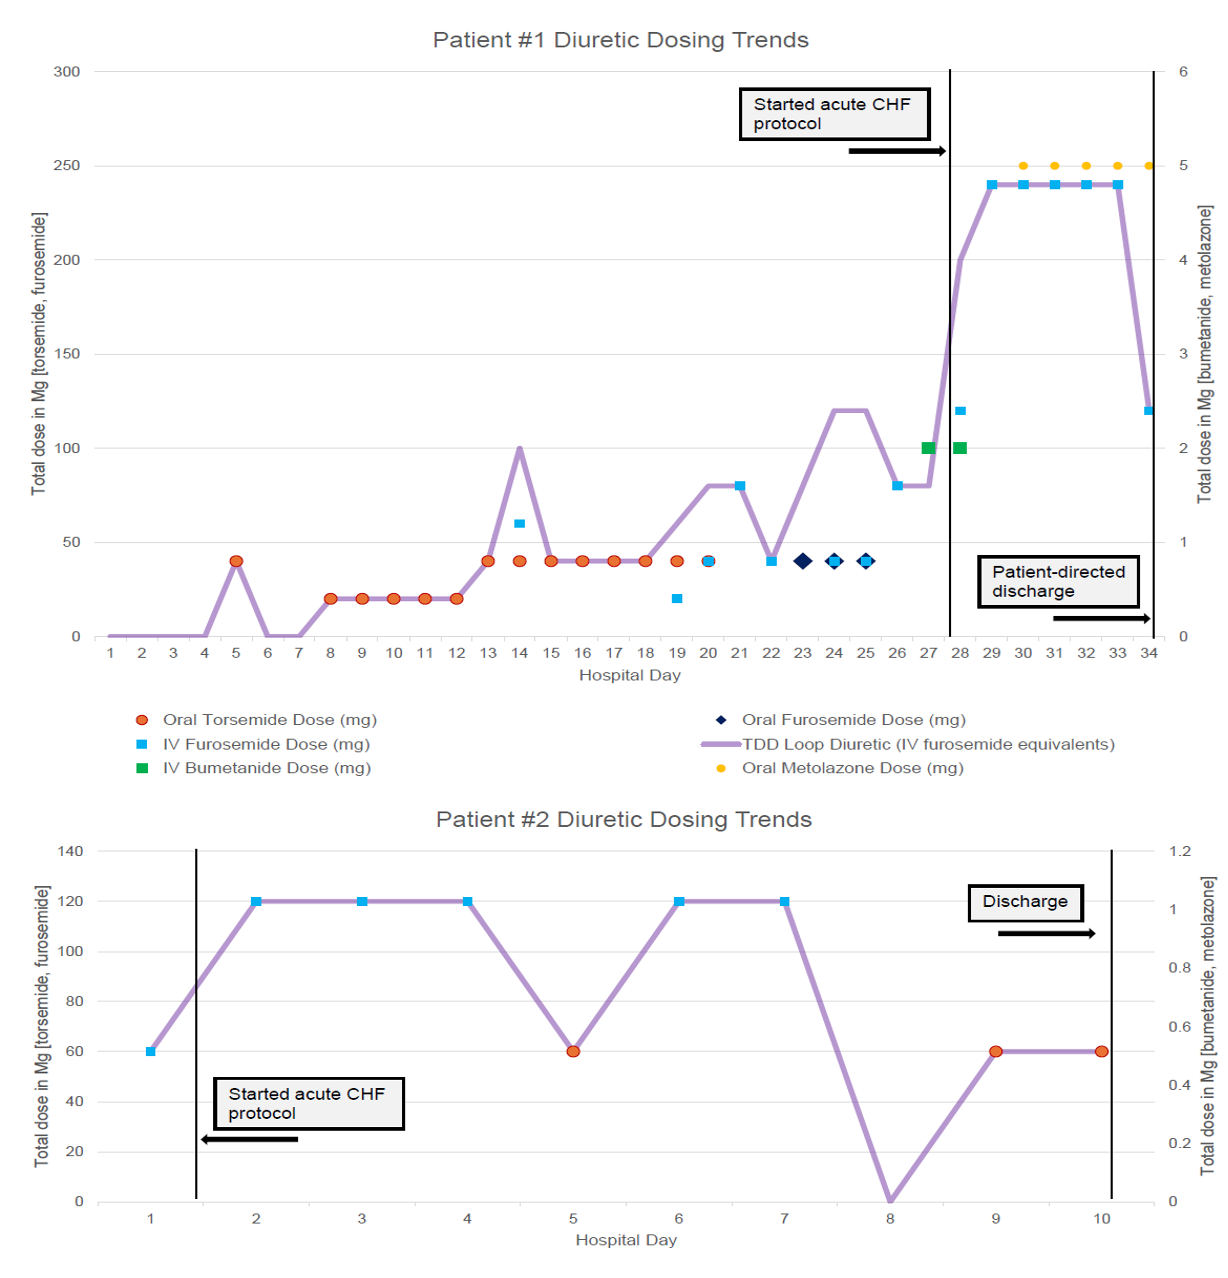
Incorporating Equity
This project is focused on vulnerable baseline population as CHF incidence and prevalence is higher among African American individuals compared with other racial and ethnic groups, as well as in lower socioeconomic status groups. Therefore, the CHF protocol was designed independent of patient selection, consent or participation based on demographic factors. We plan to measure baseline and track outcomes by demographics to ensure both equitable utilization of the protocol and outcomes. Our hope is that the utilization for the CHF protocol will reduce inter-provider variability to mitigate risk of unconscious bias.
Future Directions
To increase intentional utilization of the Acute CHF Protocol, we plan to prioritize educational initiatives of the medical providers (attendings, APPs, and residents) and to conduct periodic data set review. We will roll the protocol out in a stepwise manner on other units beyond 616.
By increasing accurate utilization of the acute CHF protocol, our ultimate aim is for SMH to have reduced average length of stay for acute CHF admissions by 0.5 days, equitably across demographics and without an associated increase in readmissions, by the end of 2027.
Acknowledgements
- HMD faculty: Tim Hansen, Justin Hopkin
- HMD APP: Sarah Antolik, James Dooher
- Cardiology faculty: Joe Delehanty, Kevin McGrody
- Pharmacy: Jennifer Nowak
- Nursing: Stephanie McBride, Shante HandFletcher
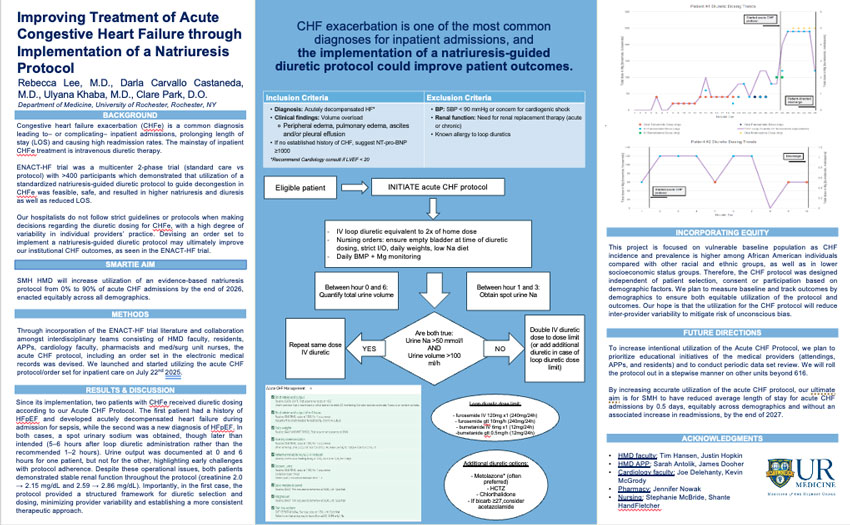
Ali Murra, M.D.; Ulyana Khaba, M.D.; Aidan Sullivan, M.D.; Chase Yuan, M.D.; Anthony Pietropaoli, M.D.; Manuel Cabrera, M.D.
University of Rochester Internal Medicine, Department of Hospital Medicine, Department of Pulmonary and Critical Care
Background
- Rapid response teams (RRTs) have been widely utilized in the hospitals, including SMH, to promptly gather specialized staff in a setting of acute deterioration of floor status patients.
- RRTs include the medical ICU senior/APP, ICU fellow, certified RN, respiratory therapist. Additional team members include the floor nurse and the primary team.
- Sepsis causes more than 1/3 of inpatient deaths.
- At SMH, the Sepsis Alert system serves as a unique function within RRTs to provide an on-site pharmacist to the team who can deliver antibiotics quickly to bedside and weigh in on antibiotic usage and ensure timely administration.
- Previous investigations at Strong Memorial Hospital showed that sepsis alerts have resulted in quicker time to antibiotic initiation and reduction in mortality.
- Sepsis alerts should be called during any rapid response (RR) when sepsis a suspected cause of a patient’s decompensation, including in cases of already suspected or known sepsis, as pharmacists may help weigh in on antibiotic usage or perform other tasks such as medication reconciliation.
- This poster is an iteration on a previous QI study that demonstrated a clear benefit of sepsis alerts by reducing mortality and ICU transfers by Shi et al.
Objectives
- Sepsis alerts have been underutilized at SMH, particularly in patients who already have a working diagnosis of sepsis.
- Previous investigations by Shi et al. have shown that sepsis alerts were called only 19% of the time when sepsis was considered as a differential diagnosis.
- Our objective was, through multiple iterations of PDSA cycles, to improve utilization rates of sepsis alerts when sepsis was a possible etiology of a patient’s decompensation during RRT activation.
- A retrospective analysis of ~ 2-month cycles were conducted to assess efficacy of interventions, with each intervention building on the previous intervention.
Methods
PDSA Cycle 1 (12/23/24-2/3/25): Our first intervention included creating a “quicksheet” document that was sent to all senior residents with their onboarding package to review prior to starting MICU rotation. This document included information that highlighted what RRT and sepsis alerts were, who was involved in these teams, when and why to call each, as well as important considerations in determining appropriate actions at the bedside. Additionally, modifications to the RR flowsheet were made that prompted considerations for upgrading RRs to sepsis alerts when called.
Rapid Response/Sepsis Team Workflow

Critical Huddle Communication:
- Working diagnosis
- Urgent work up/treatment plan
- Does patient need ICU-level care?
- Will MICU team reassess and when?
PDSA Cycle 2 (4/11/25-6/13/25): Faculty involved in teaching rapid response case review series were asked to discuss sepsis alerts and to discuss the aforementioned documents at the end of the lectures. Fellows were also asked to review these documents directly with residents prior to their MICU rotations.
PDSA Cycle 3 (under implementation): Planned intervention to update RR note templates for ICU responders to raise awareness of sepsis alerts.
For this retrospective analysis, main variables analyzed included:
- Interventions performed at rapid response
- Sepsis suspected during rapid response (from H&P, CRN note, RRT note, or MICU consult/admission note)
- Sepsis alert activated (from CRN/RRT/MICU note)
- Other factors such as progression to CMO, cardiac arrest, or death
Results
PDSA Cycle 1:
- 139 RRs analyzed
- 48 RRs had sepsis on differential
- 14 Sepsis Alerts called
RRTs with Suspected Sepsis

PDSA Cycle 2:
- 227 RRs analyzed
- 68 RRs had sepsis on differential
- 19 Sepsis Alerts called
RRTs with Suspected Sepsis

Discussion/Conclusion
- There was an improvement in utilization rates of sepsis alerts with PDSA cycle 1 compared to pre-intervention rates (29% vs 19%)
- There was no significant difference in utilization rates between PDSA cycle 1 and 2 (29% vs 28%)
- Reasons potentially include lack of education/information on non- resident medicine teams and other departments.
- Next cycles may involve: editing RRT note templates to include suggestion for Sepsis alert, spreading information to departments of other specialties, educating on Sepsis alerts during resident teaching sessions.
Limitations
- Unable to directly call pharmacy for every RRT due to resource/availability limitations.
- The primary determination of whether sepsis was suspected was based on documentation, resulting in underreporting of suspected sepsis.
Acknowledgements
- MICU faculty: Pietropaoli A., MD, Quill C., MD, Roto D., MD, MICU fellows
- HMD faculty: Cabrera, M., MD
- ICU nursing: Giambra, A.
- Xingyi Shi, MD; Andrew Sepiol, MD; Bisher Sultan, DO; Manuel Cabrera, MD; Anthony Pietropaoli, MD (URMC). "Call the Sepsis Alert: A Retrospective Analysis of Rapid Responses."

Matthew Wang MD1, Aditya Gunturi BS2, Kara Mette BS2, Caleb Wataoka BA2, John Grable MD PhD1
1Department of Medicine, University of Rochester Medical Center, Rochester, NY; 2University of Rochester School of Medicine and Dentistry, Rochester, NY
Introduction
Background
- Hospital admissions are a valuable opportunity to help patients quit smoking
- The Rochester Model is a QI program that treats inpatient smokers, consisting of bedside counseling coupled with post-discharge follow up phone calls
History
- Program initially utilized a combination of nurses, respiratory therapists, and medical students (Combined Program)
- Transitioned to medical students only in 2022 due to COVID-related staffing shortages
Purpose
- Train medical students (MS) as smoking cessation counselors and program recruiters/managers
- Provide effective cessation counseling without additional cost to the hospital
Methods
Student Recruitment & Training
- Currently a student-run organization through URSMD
- Training for bedside and post-discharge counseling done via two Zoom sessions (~1 hour each)
Counseling & Follow-Up
- Patients are enrolled from 8 hospital units. Smokers are identified through eRecord and enrolled by students
- Students perform bedside and follow-up calls. Patients are also referred to the NYS Quit Hotline
- Smoking status tracked at outcome calls at 4 weeks, 3 months, and 6 months
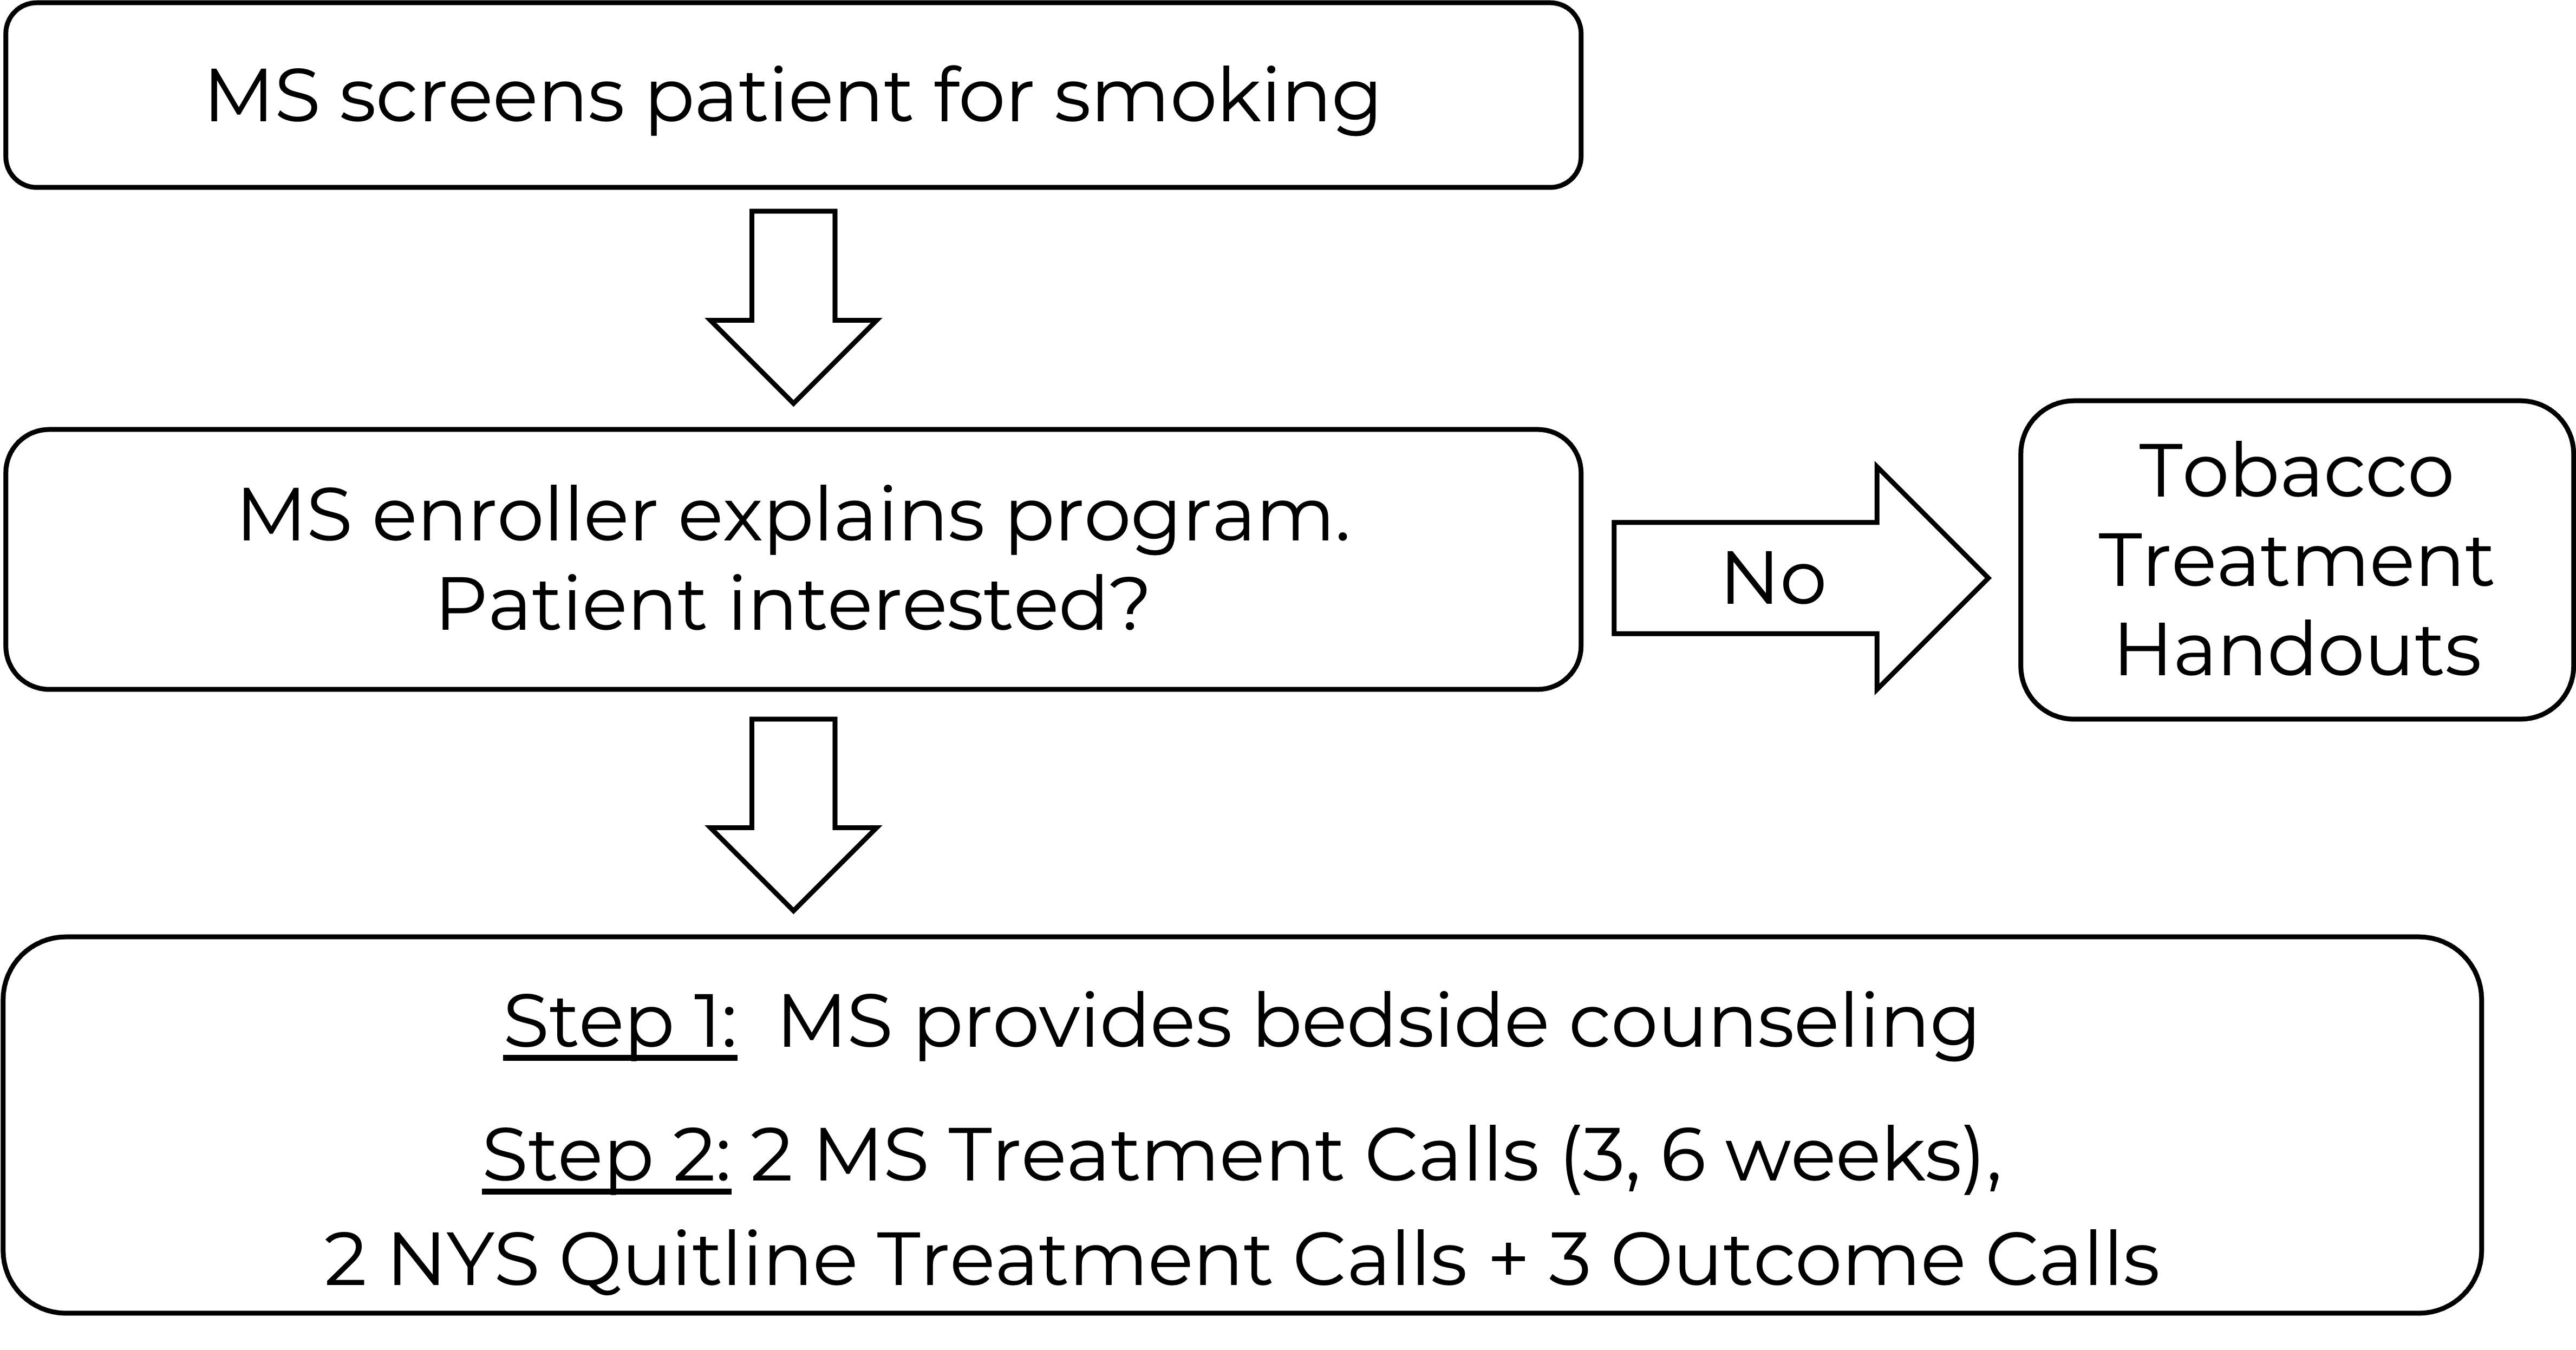
Results
Tables 1a and 1b. Outcomes for all patients counseled. Data for the MS program was collected between 1/2022 – 12/2024. Data for the combined program was collected between 1/2016 – 3/2021.
| 4 Weeks | 3 Months | 6 Months | |
|---|---|---|---|
| Quit | 78 | 46 | 41 |
| Smoke | 63 | 46 | 42 |
| Lost to follow-up | 149 | 198 | 207 |
| Total | 290 | 290 | 290 |
| 4 Weeks | 3 Months | 6 Months | |
|---|---|---|---|
| Quit | 89 | 63 | 54 |
| Smoke | 89 | 88 | 89 |
| Lost to follow-up | 207 | 234 | 242 |
| Total | 385 | 385 | 385 |
There were no significant differences between the two programs at any timepoint in the as-treated (p = 0.34, 0.21, 0.09) and the intent-to-treat groups (p = 0.26, 0.86, 0.97)
Figure 1. Quit Rates (as-treated)

Figure 2. Quit Rates (intent-to-treat)

Subgroup analysis of patients counseled by MS was performed to compare patients admitted to cardiac (n = 161) vs non-cardiac units (n = 129).
Figure 3. Quit Rates (as treated)

Figure 4. Quit Rates (intent-to-treat)
As treated: p = 0.005, 0.12, 0.75
Intent to treat: p = 0.004, 0.006, 0.07
Discussion
- Program growth from 5 medical student counselors in 2022 (initial cohort) to over 30 active counselors
- 6 month as treated quit rate (49%) exceeded the benchmark of 25% for inpatient tobacco use cessation programs
- Cardiac units demonstrated higher initial quit rates when compared to non-cardiac units, with no difference at 6 months
Conclusions
- Medical students effectively perform smoking cessation counseling with robust quit rates at 6 months follow up
- Recent cardiac admission appears to provide a strong initial impetus for smoking cessation
- Program combines student training and patient treatment at no additional cost to the hospital

Ronald Lott DO, Katherine Woo MD, Danielle Henry PharmD, Stephanie Wiemeier PharmD, Meghan K. Train DO, Catherine Glatz MD
University of Rochester Medical Center
Background
- Accurate medication reconciliation plays a crucial role in patient outcomes and safety, yet studies have shown that up to 60% of admitted patients have a medication reconciliation error (1-3).
- Significant harm can be done on discharge if an inaccurate discharge medication reconciliation is completed. For example: patient at SMH with new VTE nearly discharged without anticoagulation.
- The severity of these errors can be classified as low, serious, or life-threatening, based on their significance or potential ability to cause harm (4). These errors can further be classified by the type of error, such as wrong medication ordered, wrong route/dosage form, therapy not indicated, therapy omission, etc. (5).
- Given the clinical significance of these errors, there have been efforts at other institutions to attempt to reduce the number of errors, many of which have looked at integrating assistance from pharmacy. This has come in the form pharmacist-led medication reconciliation, as well as pharmacy involvement during inpatient rounds (10-12), both of which were associated with reduction in medication errors. Pharmacist involvement has been shown to reduce ‘errors’ in various studies (6, 10) and to reduce re-hospitalizations as well as cost (7), and can be fostered by a positive culture, early introductions, and bidirectional communication (8. 9).
SMART AIM
Our project aims to reduce the total number of ‘error’ on discharge medication reconciliation by 25% by May 2026.
Methods
- With assistance from unit pharmacists on 614 and 634, we collected data on medication errors from discharge medication reconciliations, which were further categorized by type of error.
- We then piloted ‘pharmacy rounds’ on two hospital medicine teams while running the list on two 26-bed med-surg units (614, 634), both of which are resident led units
- We have collected feedback from this pilot and plan to expand this to all resident hospital medicine teams. We will then reassess data to determine the impact on reduction in medication errors
PDSA Cycles
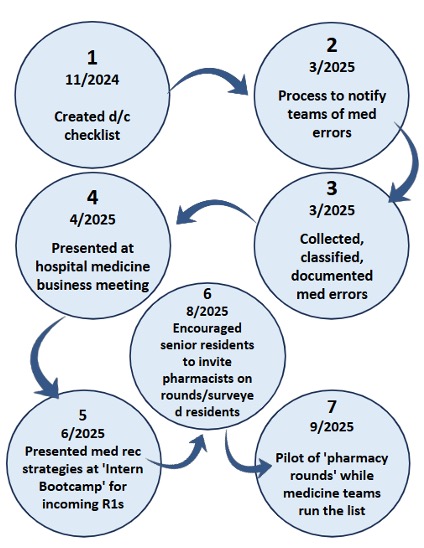
Our Data
Number of Data Points per Error Category (Combined & Consolidated)
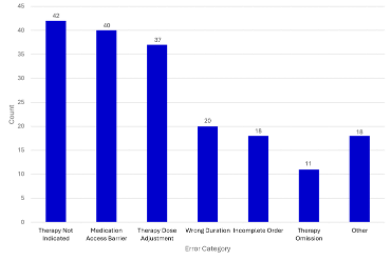
- Over a two month period 188 total errors were identified
- 34.1% were considered serious errors (labelled D or E on national Coordinating Council for Medication Error Reporting and Prevention scale)
Future Endeavors
- Collection of post intervention data
- Restructuring of pharmacy staff to join specific medicine teams on rounds rather than unit based pharmacists on resident units
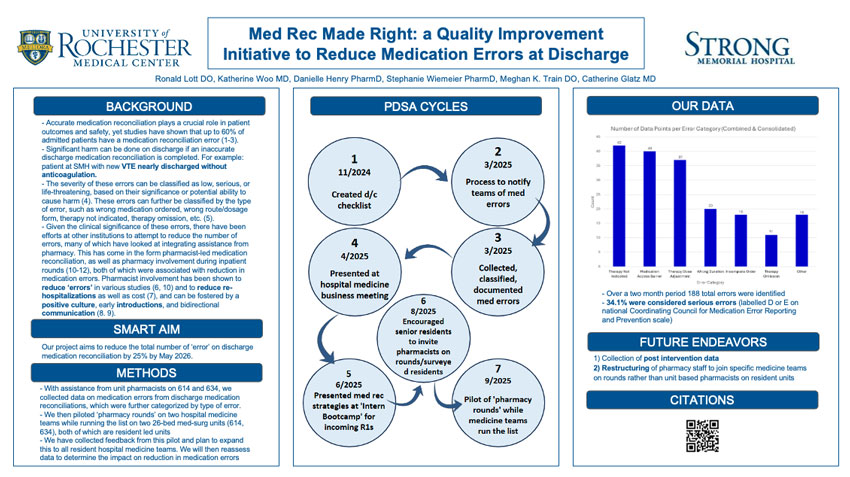
Emily Wu, MD1, Paul Vermilion, MD2
1Department of Medicine, University of Rochester Medical Center; 2Department of Medicine, Palliative Care, University of Rochester Medical Center
Problem
- Medical cannabis has been shown to provide quality-of-life benefit for patients struggling with conditions including chronic pain,1 chemotherapy-induced nausea and vomiting,2 and epilepsy.3
- Use of medical cannabis can minimize burden of other medications such as opiates.4
- Historically at URMC, barriers to ordering medical cannabis inpatient included:
- Restrictive institutional policies
- Provider knowledge gaps
- Inefficient pharmacy approval process
Aim
- Increase the percentage of medical cannabis ordered inpatient for appropriate patients.
- Improve the workflow process when ordering medical cannabis inpatient for both providers and pharmacists
Interventions
Designed and implemented Medical Cannabis order set in eRecord - went live May 2024
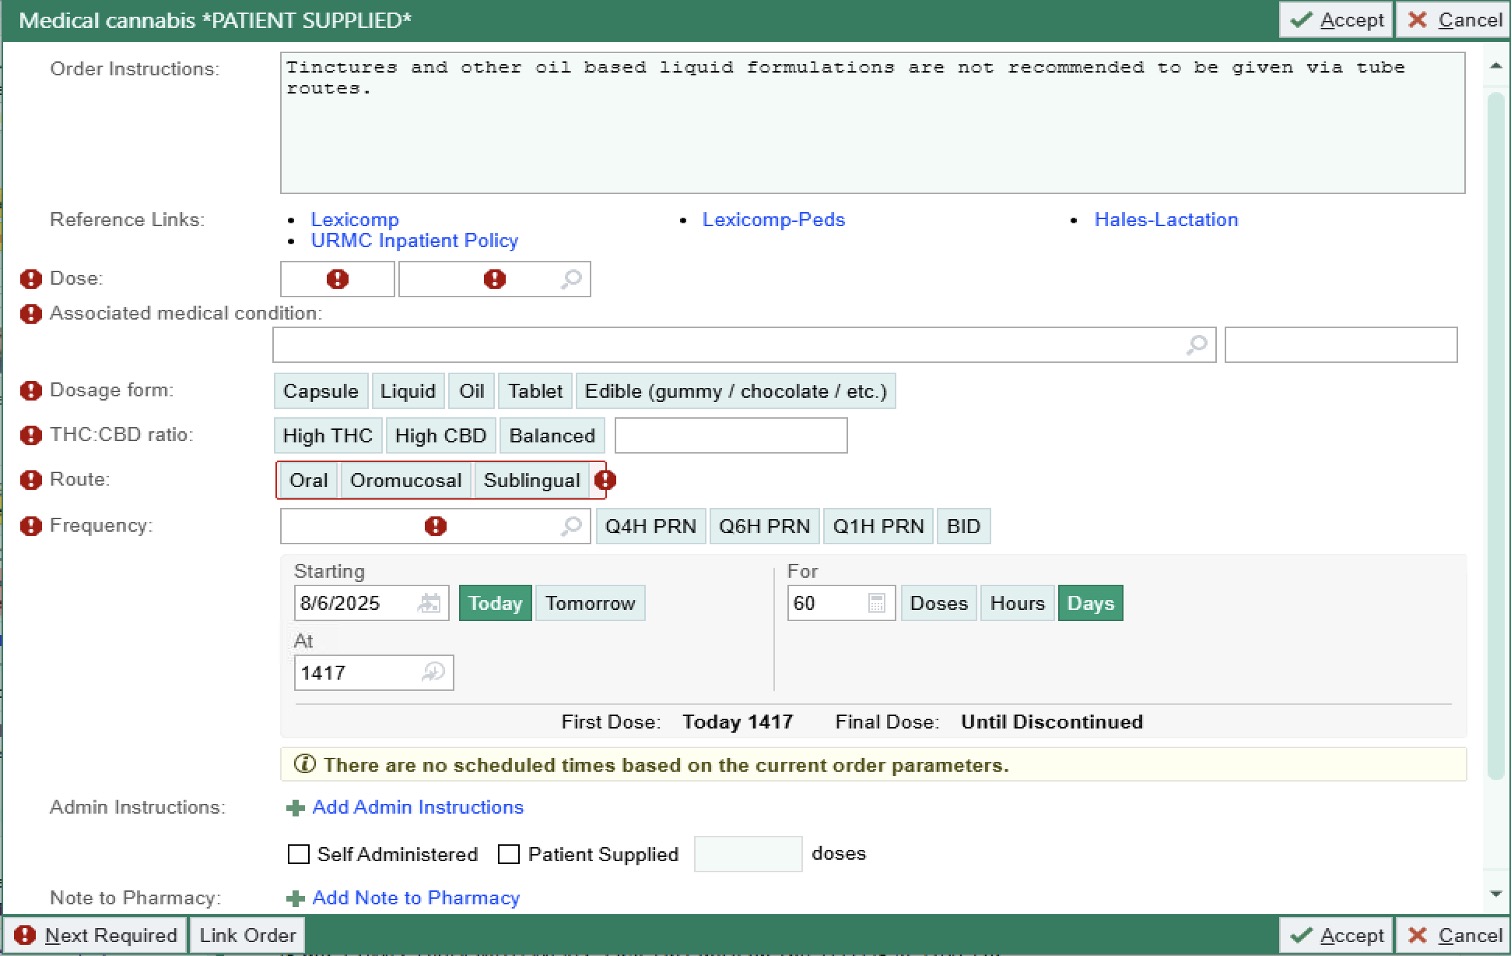
Results
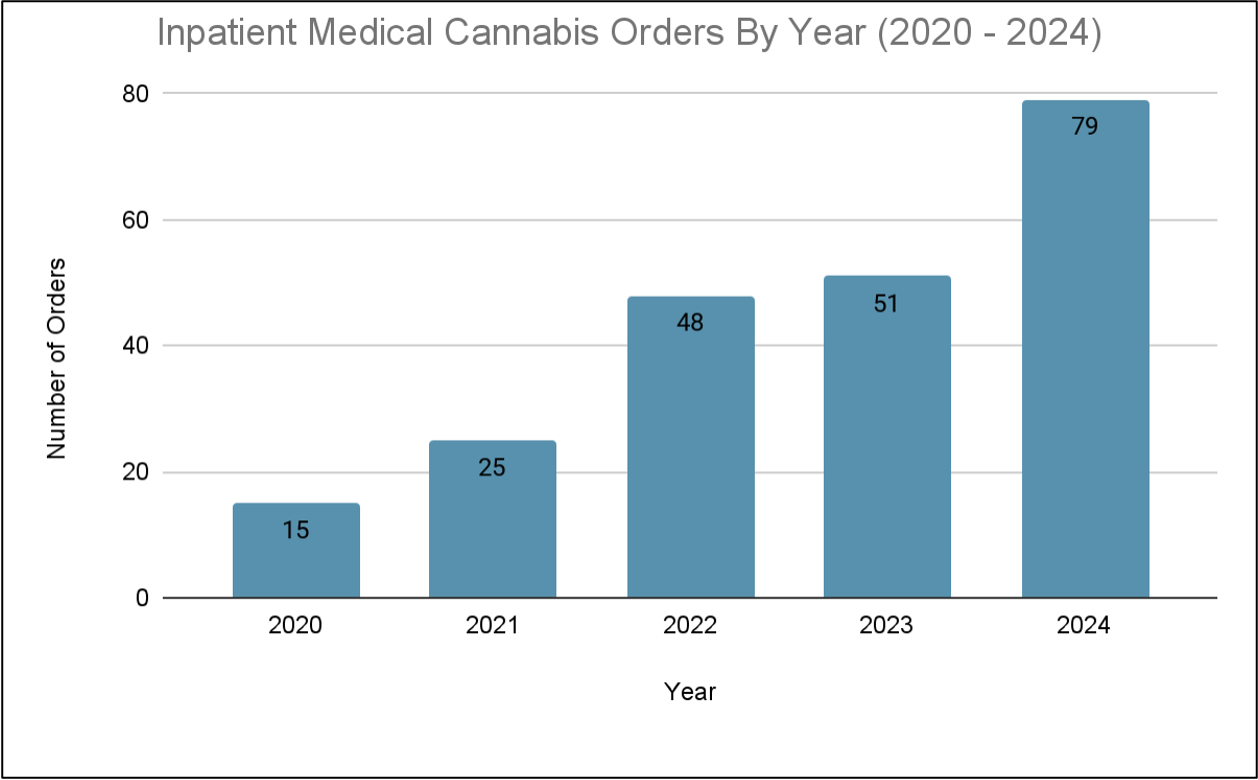
Inpatient orders for canabis have increase over the past 5 years.
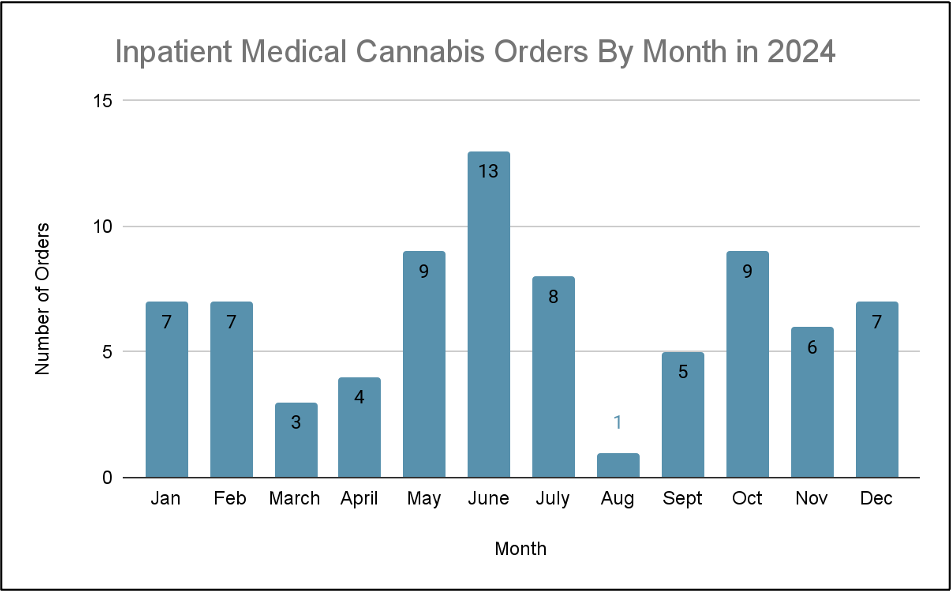
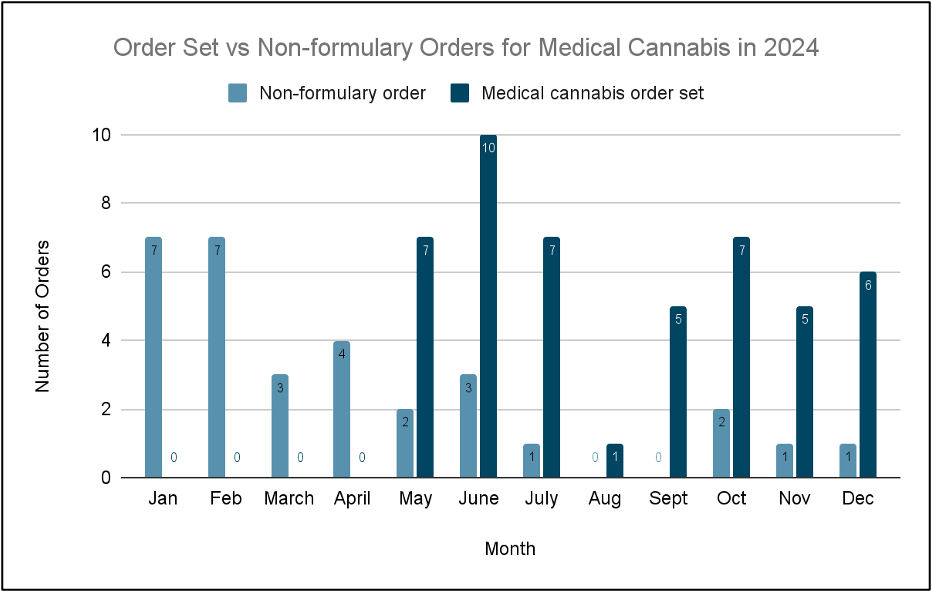
After the order set went live in May 2024, inpatient medical cannabis orders were predominantly placed using the order set.
Inpatient Medial Cannabis Orders by Med Rec Status
| 2020 | 2021 | 2022 | 2023 | 2024 | |
|---|---|---|---|---|---|
| Total patients with medical cannabis on med rec | 38 | 35 | 35 | 34 | 18 |
| Ordered inpatient | 6 | 10 | 11 | 11 | 8 |
| Not ordered inpatient | 32 | 25 | 24 | 23 | 10 |
| Percentage of those ordered inpatient* | 15.70% | 28.50% | 31.40% | 32.40% | 44.40% |
*% of inpatient cannabis orders for patients with cannabis on admission med rec have risen over the past 5 years.
Qualitative Feedback Session Takeaways
- WCC APP and hospitalist group
- Department culture: historically involved Palliative Care when ordering medical cannabis
- Workflow: unaware that order set could be accessed directly from initial med rec when admitting patients
- ED pharmacist
- Prevalence of inappropriate orders: burden on pharmacy to verify; several instances where medical cannabis ordered despite not meeting criteria per URMC policy (ex. unlabelled products)
- Provider-side knowledge: confusion regarding appropriately selecting CBD:THC ratio
- Workflow: any changes to order set require new order to be placed from provider
Lessons Learned
- Medical cannabis is increasingly ordered inpatient in the last 5 years
- There was increased utilization of the medical cannabis order set instead of non formulary orders - however there remains room to improve
- To ease pharmacist workload, target medical cannabis order set for patients meeting URMC policy criteria, rather than broadly increasing utilization
Next Steps
- Further provider education
- Boost awareness that order set exists
- Ongoing policy changes
- Implementing policy for dispute resolution?
- Order set verification workflow
- Making order set editable by providers
References
- Safakish, Ramin, et al. "Medical cannabis for the management of pain and quality of life in chronic pain patients: a prospective observational study." Pain Medicine 21.11 (2020): 3073-3086.
- Troyer, James, and Kimberson Tanco. "Review of the use of medicinal cannabis products in palliative care." Cancers 16.7 (2024): 1412.
- Gaston, Tyler E., et al. "Quality of life in adults enrolled in an open-label study of cannabidiol (CBD) for treatment-resistant epilepsy." Epilepsy & Behavior 95 (2019): 10-17.
- Nguyen, Trang, et al. "Changes in prescribed opioid dosages among patients receiving medical cannabis for chronic pain, New York State, 2017-2019." JAMA Network Open 6.1 (2023): e2254573-e2254573.
Acknowledgements
Thanks to Raquel Jones, PharmD, Wilmot Cancer Center APP and hospitalist group, Justin Foster, PharmD, MS, Rich Mays - UR CTSI Informatics and Analytics.
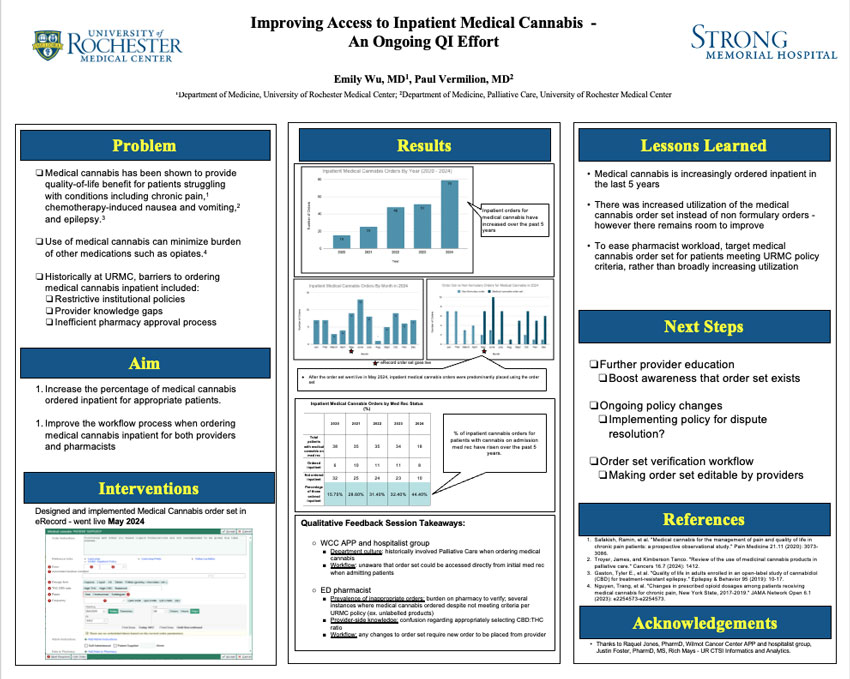
Past Award Winners