Supplemental Data for Auvergne & Sim et al., 2013
Transcription Differences between Normal and Glioma-Derived Glial Progenitor Cells Identify a Core Set of Dysregulated Genes
Romane M. Auvergne1,2,*, Fraser J. Sim1,2,5, Su Wang1,2, Devin Chandler-Militello1,2, Jaclyn Burch1,2, Yazan Al Fanek 1,2, Danielle Davis 1,2, Abdellatif Benraiss 1,2, Kevin Walter1,3, Pragathi Achanta6, Mahlon Johnson4, Alfredo Quinones-Hinojosa6, Sridaran Natesan8, Heide Ford 7, and Steven A. Goldman1,2,*
1Center for Translational Neuromedicine, Departments of 2Neurology, 3Neurosurgery, and 4Pathology,
University of Rochester Medical Center, Rochester, NY 14642;
5Dept. of Pharmacology, University of Buffalo, Buffalo, NY;
6Dept. of Neurosurgery, Johns Hopkins University School of Medicine;
7Obstetrics and Gynecology, University of Colorado Denver, Aurora, CO, 80045;
8Sanofi-Aventis Pharmaceuticals, Cambridge, MA.
*Correspondence: Romane Auvergne
Contents
Supplemental Information
Supplemental Tables
View/Download documents listed below from our shared folder
This table includes both MACS and FACS-derived estimates of the incidence of A2B5+ cells in normal white matter, and in gliomas derived across a broad spectrum of malignant phenotypes.
NT: non-tumor; OLG: oligodendroglioma; AST: astrocytoma; AOLG: anaplastic OLG; AAST: anaplastic AST; GBM: glioblastoma.
Supplemental Table 2 (related to Figure 2): Pathology of the glioma samples used for microarray analysis
Clinical descriptions and neuropathology of the 20 human glioma samples used for the microarray analyses.
WHO: World Health Organization; ND: not determined; WT: wild type; MT: mutant
Supplemental Table 3 (related to Figure 2): Genes up-regulated in glioma-derived A2B5+ cells relative to their nontumor homologs.
Genes whose expression was 3-fold or greater than the mean expression level and significance at 1% FDR were identified as significantly up-regulated in glioma-derived A2B5+ cells (n=20) relative to their non-tumor A2B5+ counterparts (n=8) isolated from adult human white matter and cortex (worksheet 1). The same type of differential gene expression analysis was used to identify the genes that were up-regulated in glioma- derived A2B5+ cells according to the grade (worksheets 2-4) and the phenotype (worksheets 5-13) of the tumors analyzed.
FDR: false discovery rate.
Supplemental Table 4 (related to Figure 2): Genes down-regulated in glioma-derived A2B5+ cells relative to their nontumor homologs.
Genes whose expression was decreased by 3-fold or greater relative to the mean expression level and significance at 1% FDR were identified as significantly down- regulated in glioma-derived A2B5+ cells (n=20) relative to their non-tumor A2B5+ counterparts (n=8) isolated from adult human white matter and cortex (sheet1). The same type of differential gene expression analysis was used to identify the genes that were up-regulated in glioma-derived A2B5+ cells according to the grade (sheets 2-4) and the phenotype (sheets 5-13) of the tumors analyzed.
FDR: false discovery rate.
Supplemental Table 5 (related to Figure 2): Functional categories of genes differentially expressed in glioma-derived A2B5+ cells relative to their nontumor homologs
Genes whose expression was 3-fold or greater than the mean expression level and significance at 1% FDR were identified as significantly deregulated in glioma-derived A2B5+ cells (n=20) relative to their non-tumor A2B5+ counterparts (n=8) isolated from adult human white matter and cortex (sheet1). These genes were annotated into functionally relevant categories using 2 distinct types of functional analysis. Hypergeometric tests were based on gene ontology (GO) and KEGG pathway annotations (sheets 2-7). Functional analysis based on biological networks, functions and canonical pathways were generated through the Ingenuity Pathway Analysis (IPA) system (sheets 13-16). Finally, Gene Set Enrichment Analysis (GSEA) was performed across the complete list of genes using 5% FDR corrected p-values (sheets 8-12).
FDR: false discovery rate.
Supplemental Table 6 (related to Figure 2): Functional categories of genes differentially expressed in low-grade derived A2B5+ cells relative to their nontumor homologs.
Genes whose expression was 3-fold or greater than the mean expression level and significance at 1% FDR were identified as significantly deregulated in A2B5+ cells derived from low-grade gliomas (n=10) relative to their non-tumor A2B5+ counterparts (n=8) isolated from adult human white matter and cortex (sheet1). These genes were annotated into functionally relevant categories using 2 distinct types of functional analysis. Hypergeometric tests were based on gene ontology (GO) and KEGG pathway annotations (sheets 2-7). Functional analysis based on biological networks, functions and canonical pathways were generated through the Ingenuity Pathway Analysis (IPA) system (sheets 13-16). Finally, Gene Set Enrichment Analysis (GSEA) was performed across the complete list of genes using 5% FDR corrected p-values (sheets 8-12).
FDR: false discovery rate
Supplemental Table 7 (related to Figure 2): Functional categories of genes associated with anaplastic progression in glioma-derived A2B5+ cells relative to their non- neoplastic homologs.
Genes whose expression was 3-fold or greater than the mean expression level and significance at 1% FDR were identified as significantly deregulated in A2B5+ cells derived from high-grade gliomas (n=10) relative to their lower-grade counterparts (n=10) (sheet1). These genes were annotated into functionally relevant categories using 2 distinct types of functional analysis. Hypergeometric tests were based on gene ontology (GO) and KEGG pathway annotations (sheets 2-7). Functional analysis based on biological networks, functions and canonical pathways were generated through the Ingenuity Pathway Analysis (IPA) system (sheets 13-16). Finally, Gene Set Enrichment Analysis (GSEA) was performed across the complete list of genes using 5% FDR corrected p-values (sheets 8-12).
FDR: false discovery rate
Supplemental Table 8 (related to Figure 2): TGFß and wnt pathways gene expression associated with glioma genesis and anaplastic progression of glioma-derived A2B5+ cells
Data listed include the top up-regulated and down-regulated TGFß and WNT-pathways related genes (>3 FC, 1% FDR) in glioma-derived A2B5+ (n=20) cells relative to their non-tumor homologs (n=8) derived from the adult human white matter and cortex (page1). The same type of differential gene expression analysis was used to identify the TGF-ß and Wnt-pathways related genes that were deregulated in glioma-derived A2B5+ cells according to the grade (page 2-4) and the phenotype (page4) of the tumors analyzed.
FC: fold change; FDR: False discovery rate
Supplemental Table 9 (related to Figures 2-4): Quantitative real-time PCR analysis of selected genes deregulated in glioma-derived A2B5+ cells, relative to their non-tumor homologs.
To validate the array data, selected target genes were chosen for real-time Taqman q- PCR validation using a 96-gene Taqman low-density array (TLDA) (sheets 1-3;7) or individual pre-validated Taqman assays (Assays-on-demandTM, Applied Biosystems) (sheet 4) following normalization to GAPDH and calculation of p values from δCt values. Expression data was analyzed using a moderated t-test statistic with a 5% false discovery rate cut-off to compare glioma-derived A2B5+ tumor cells (n=19) to their non- tumor A2B5+ counterparts (n=5) as presented on sheet 1. Similar analysis was performed to compare differential gene expression associated with tumor grade (sheet 2) and tumor phenotype (sheet 3), as well as for the identification of dysregulated genes in A2B5+ tumor cells to their tumor A2B5- counterpart (sheet 7). Non-TLDA individual analysis was performed on log-transformed data and p-values calculated using 1-way ANOVA followed by Tukey pairwise comparisons (p<0.05) (sheet 4). A complete list of the different probes used for each individual gene is given in sheet 5 and 6, for respectively, TLDA and non-TLDA gene expression assays.
Supplemental Table 10 (related to Figure 7): In vivo tumorigenicity of CD24-selected cells from glioblastomas
Table summarizing the number of cells injected and xenograft results by sorted cell populations. CD24-selected cells have been transplanted into the brain of immunodeficient mice that have been sacrified 6 weeks post-surgery.
Supplemental Figures
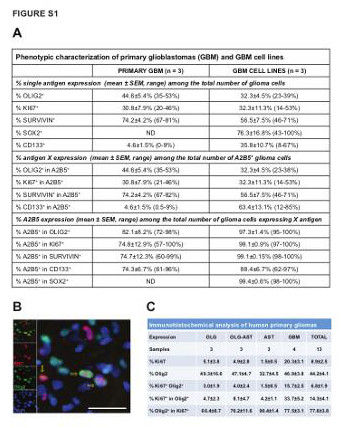
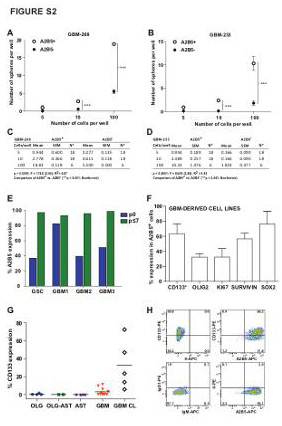
Supplemental Figure S1 (related to Figure 1): Identification of neoplastic glial precursor like cells in human primary gliomas and GBM-derived cell lines |
|---|
| (A) Table summarizing the percentage of single and co-expression of CD133, Sox2, A2B5, Olig2, Ki67 and survivin markers, using both flow cytometry and immunocytochemical based techniques, in primary glioblastoma and GBM-derived cell lines in vitro. (B) Representative micrograph of human glioblastoma, immunostained for Olig2 (green) and the proliferative marker Ki67 (red) in situ. The yellow arrow indicates co-localization of both proteins. Scale bar = 100µm. (C) Table showing the percentage of Olig2 and Ki67+ cells in the entire population (mean±SEM). Olig2+Ki67+ indicates the percentage of double-positive cells in the whole population. Olig2+ in Ki67+ cells indicates the percentage of double-positive cells among Ki67+ cells. Ki67+ in Olig2+ cells indicated the percentage of double-positive cells among Olig2+ cells. OLG: Oligodendroglioma; OLG-AST: Oligo-astrocytoma; AST: Astrocytoma; GBM: Glioblastoma. |
 View PNG |
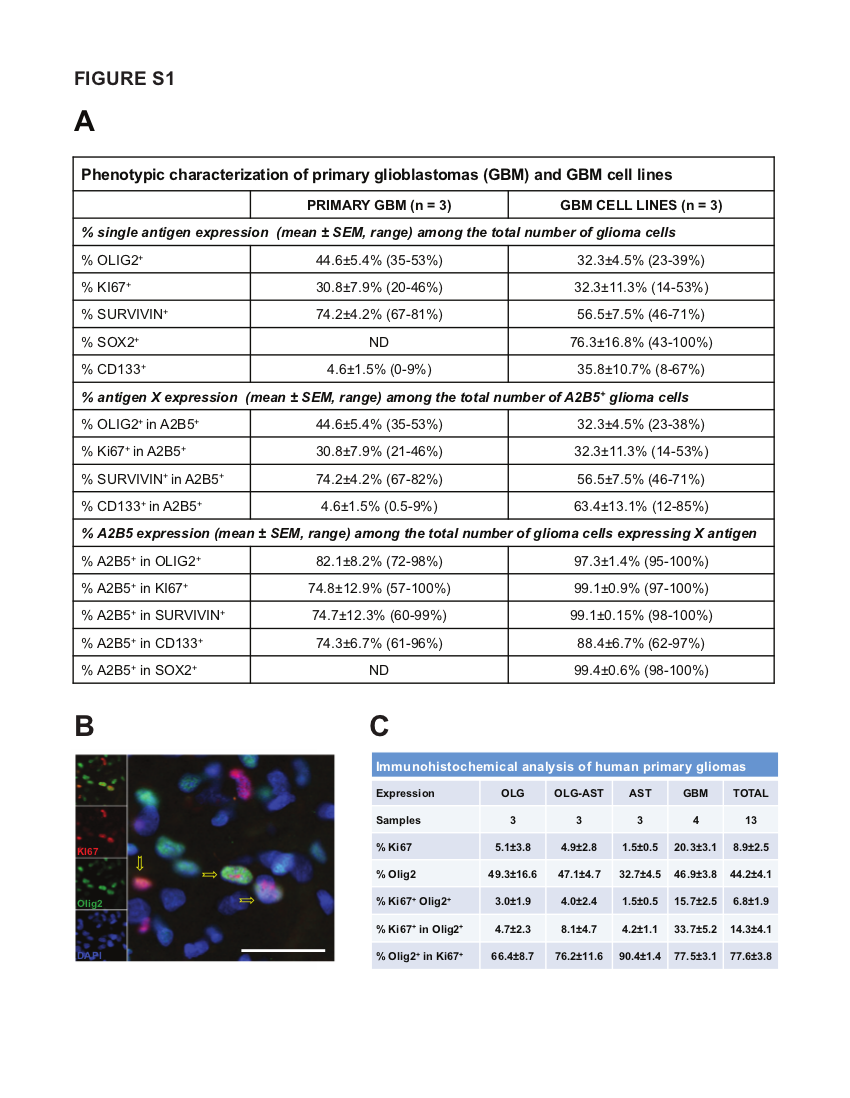
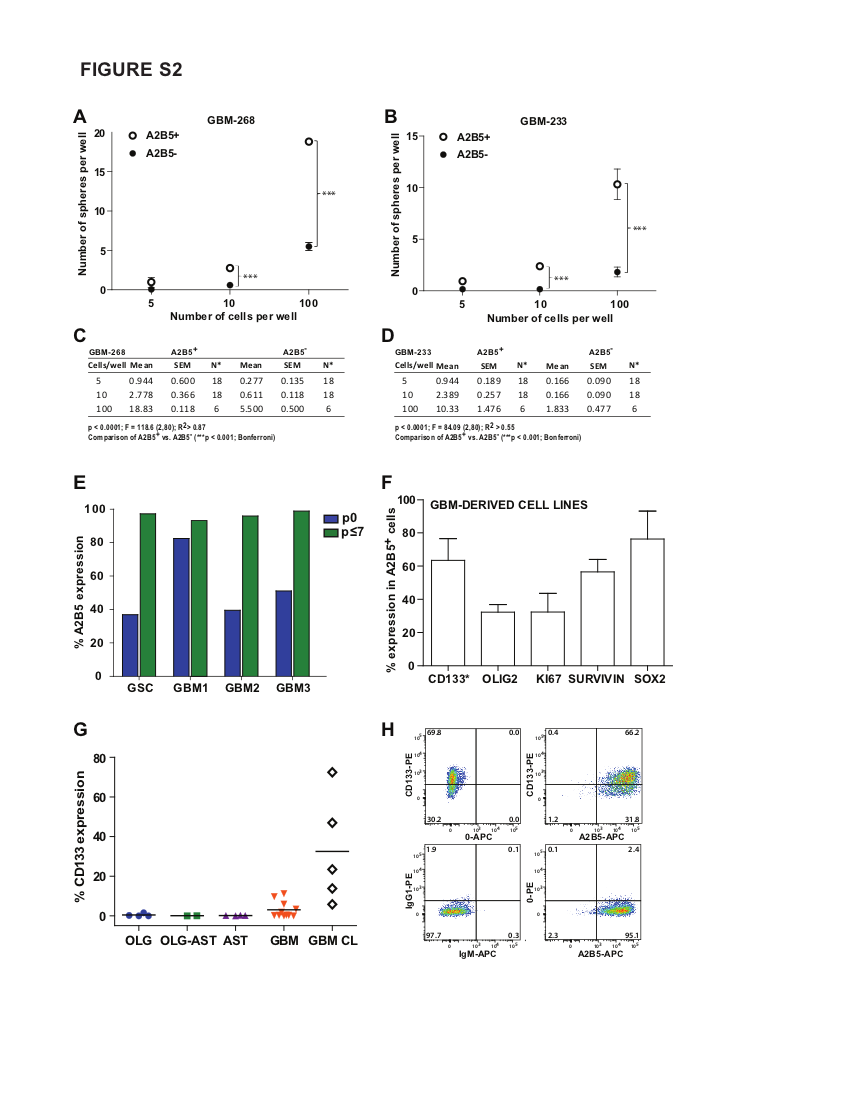
| Supplemental Figure S2 (related to Figure 1): Characterization of A2B5+ cells in GBM-derived TIPC lines |
|---|
| (A-D) A2B5+ and A2B5- cells isolated from 2 different GBM-derived cell lines (GBM-268 and GBM-233) were plated into 96-well plates with a FACS-automated cell deposition unit (ACDU), at seeding densities of either 5, 10 or 100 cells per well (n=6-18 wells/density level per line). The cells were cultured in serum-free media for 14 days, and resultant glial spheres were individually counted using an inverted microscope. Results are expressed following a non-linear regression analysis. Graphed as mean ± SEM. N = Number of replicate wells. (E) Flow cytometry analysis of A2B5 expression in 4 representative primary gliomas and their derived cell lines. (F) Flow cytometry (*) and immunocytochemical analysis of GBM-derived cell line (n=3) for A2B5, CD133, Sox2, Survivin, Olig2 and Ki67 expression. (G) Flow cytometry analysis of CD133 expression cells in a total of 21 primary gliomas and 5 GBM cell lines. Horizontal lines indicate mean percentages. (H) Representative scatter plot of a GBM-derived cell line, stained with A2B5 (bottom right), CD133 (upper left), A2B5 and CD133 together (upper right), or their isotype-matched controls (bottom left). AST: Astrocytoma; OLG: Oligodendroglioma; OLG-AST: Oligo-astrocytoma; GBM: Glioblastoma; GSC: Gliosarcoma; p: passage; TIPC: tumor initiating precursor cell. |
 View PNG |
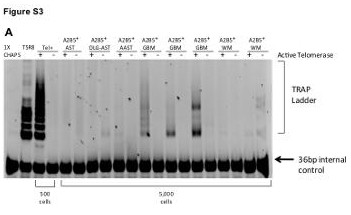
| Supplemental Figure S3 (related to Figure 1): Glioblastoma-derived A2B5+ cells behaved as transformed neural precursor cells in vitro |
|---|
| (A) Telomerase activity in glioma-derived A2B5+ cells relative to nontumor A2B5+ GPCs. Telomerase activity as assessed by the TRAP (telomeric repeat amplification protocol) assay, in A2B5+ cells isolated from low- and high- grade gliomas as well as from nontumor human white matter (WM). 1X CHAPS is a negative control, TSR8 is a telomerase positive control for quantification. Tel +/-: Telomerase active or heat- inactivated, respectively. A 36-bp marker was used as an internal control. AST: Astrocytoma; OLG-AST: Oligo-astrocytoma; AAST: Anaplastic astrocytoma; GBM : Glioblastoma; WM : White matter |
 View PNG |
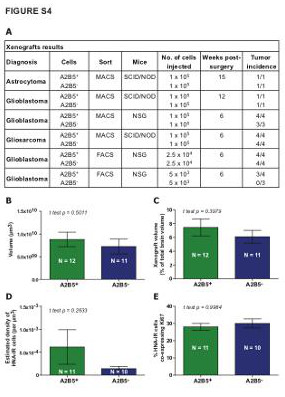
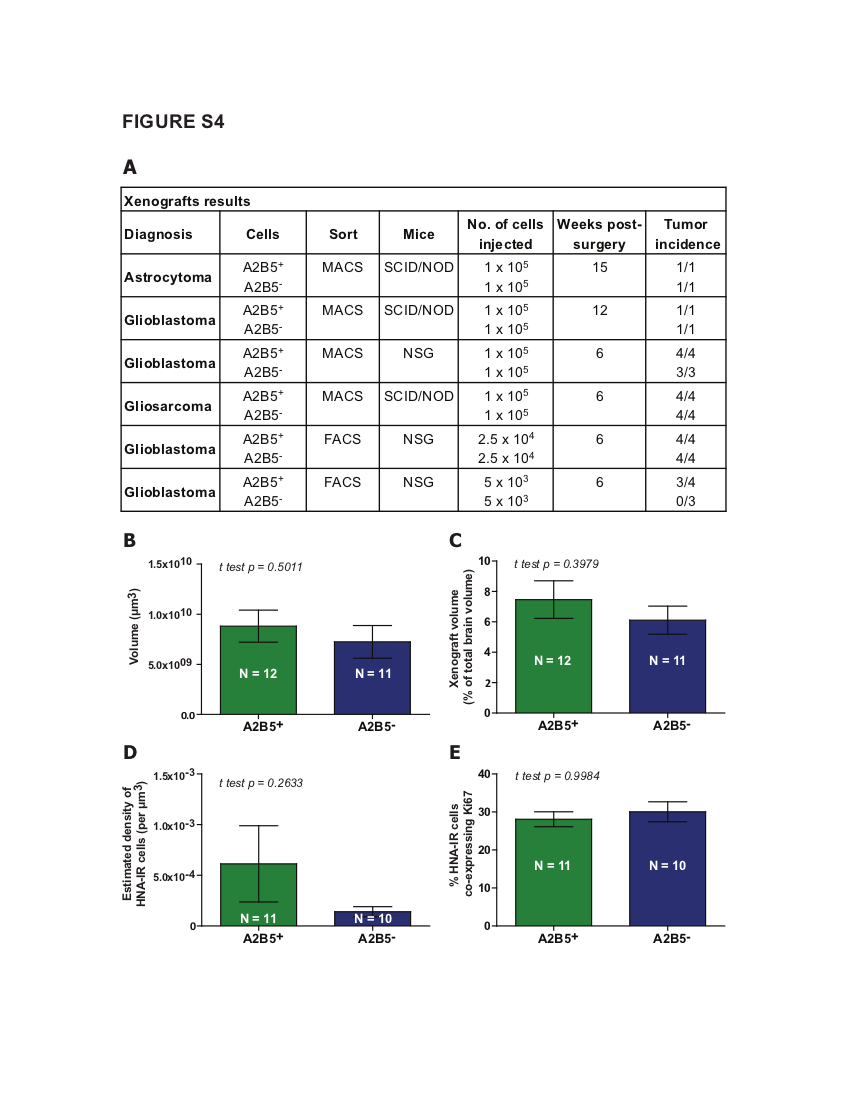
| Supplemental Figure S4 (related to Figure 1): In vivo tumorigenesis by glioma-derived A2B5+ cells in orthotopic xenografts |
|---|
| (A) Table summarizing the sorting strategy, type of immunodeficient mice, number of cells injected, delay post-surgery and xenograft results by sorted cell populations. (B-E) Bar plot demonstrating that both A2B5+ and A2B5- sorted cells, isolated from glioma using MACS-based strategy, were able to induce highly invasive tumors after transplantation in vivo, without significant differences according to the volume (B-C), the estimated density of human-nuclei stained cells (D) or the number of Ki67+ dividing cells (E). |
 View PNG |
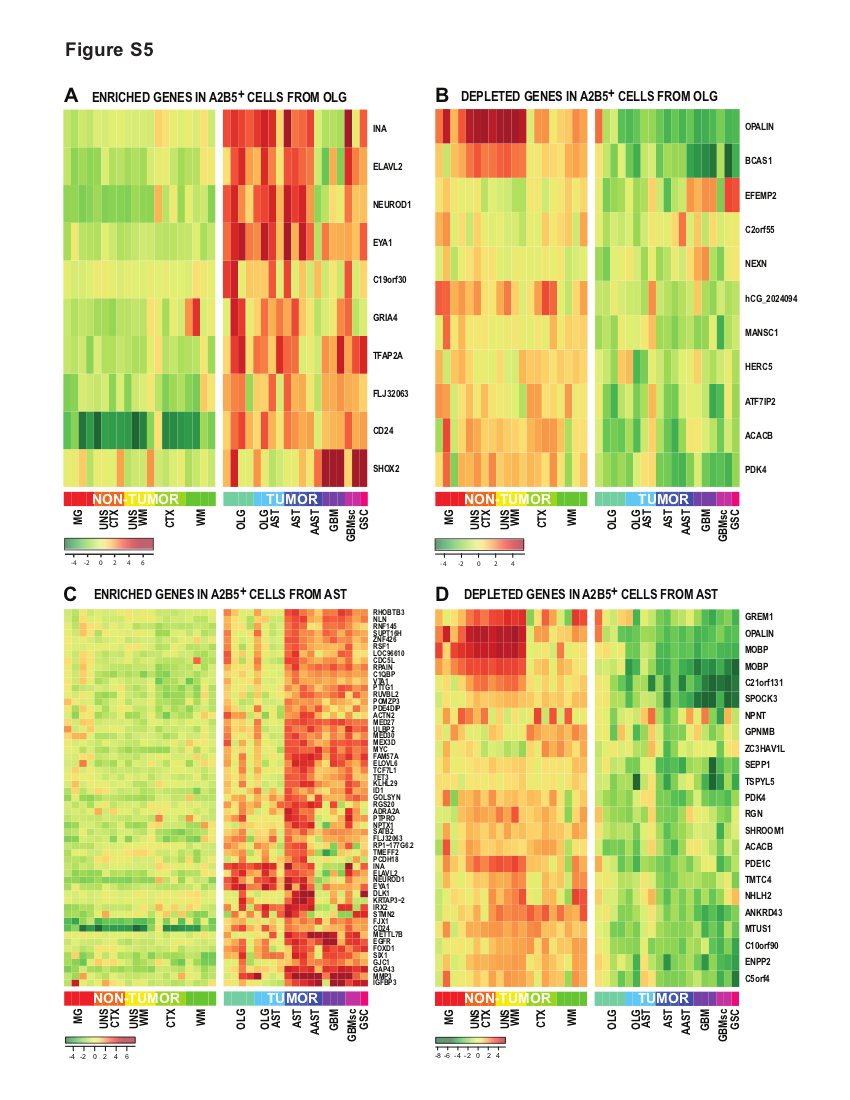
| Supplemental Figure S5 (related to Figure 2): Specific genes deregulated in A2B5+ glioma cells derived from oligodendroglial and astrocytic tumors |
|---|
| (A-B) Heat-map representation of the top up-regulated (A) and down-regulated (B) genes in A2B5+ glioma cells derived from oligodendroglioma, as assessed by microarray analysis and compared to normal A2B5+ glial progenitor cells (GPCs) derived from adult white matter (WM), cortex (CTX), or CD11b+ microglia (MG) (C-D) Heat-map representation of the top up-regulated (A) and down-regulated (B) genes in A2B5+ glioma cells derived from astrocytoma, as assessed by microarray analysis and compared to normal A2B5+ GPCs derived from adult WM, CTX, or CD11b+ MG MG: microglia; UNS CTX: unsorted cortical cells; UNS WM: unsorted white matter cells; CTX: A2B5+ cells from normal cortex; WM: A2B5+ cells from normal white matter; AST: Astrocytoma; AAST: anaplastic astrocytoma; OLG: Oligodendroglioma; OLG-AST: Oligo-astrocytoma; GBM: Glioblastoma; GBM sc: small cell GBM; GSC, gliosarcoma; |
 View PNG |
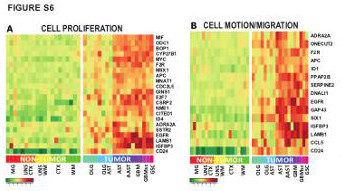
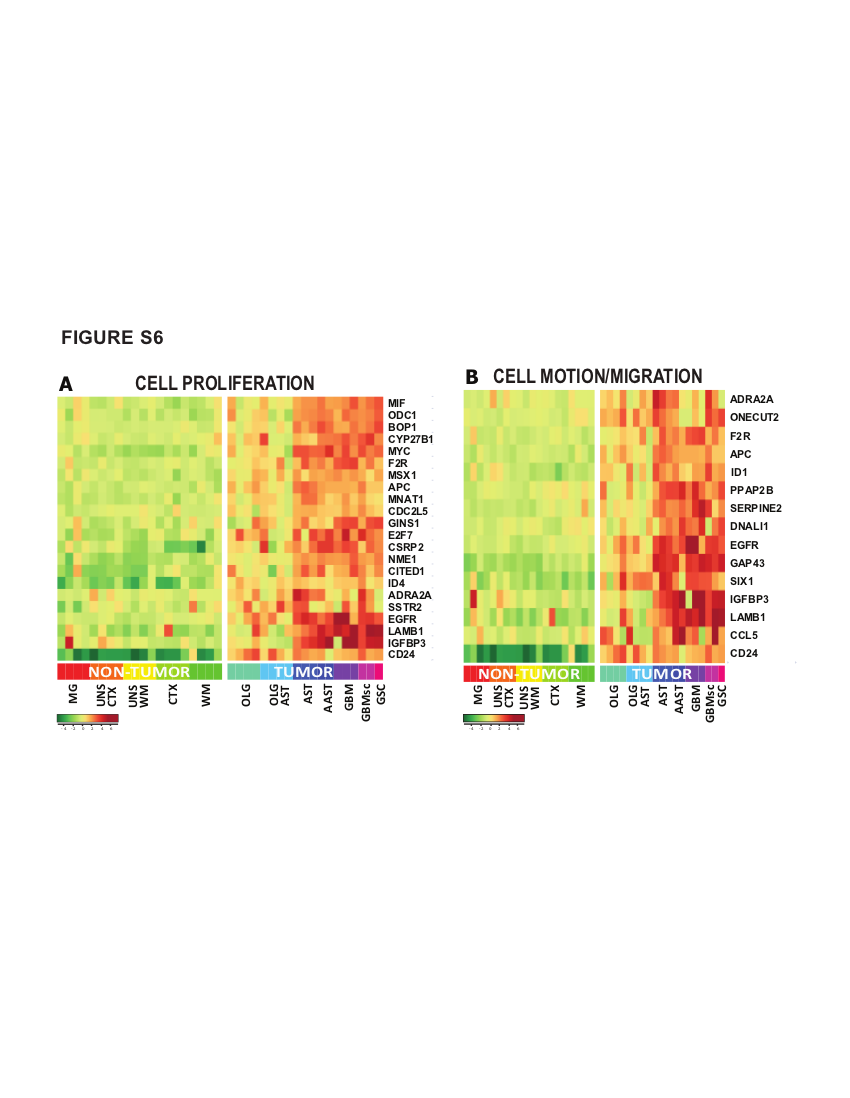
| Figure S6 (related to Figure 2): Functional categories of genes significantly dysregulated in A2B5+ cells at all stages of gliomagenesis |
|---|
| (A-B) Hyper-geometric over-representation analysis of Gene-Ontology-based annotations identified (A) cell proliferation, and (B) cell migration-related genes as differentially over-expressed in A2B5+ sorted cells from gliomas, compared to their non- tumor homologs. MG: microglia; UNS CTX: unsorted cortical cells; UNS WM: unsorted white matter cells; CTX, A2B5+ cells from normal cortex; WM, A2B5+ cells from normal white matter; AST: Astrocytoma; AAST: anaplastic astrocytoma; OLG: Oligodendroglioma; OLG-AST: Oligo-astrocytoma; GBM: Glioblastoma; GBM sc: small cell GBM; GSC, gliosarcoma |
 View PNG |
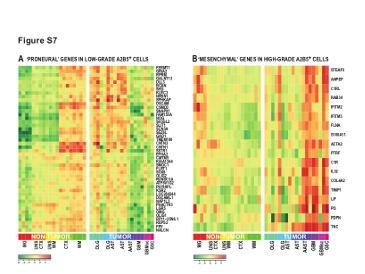
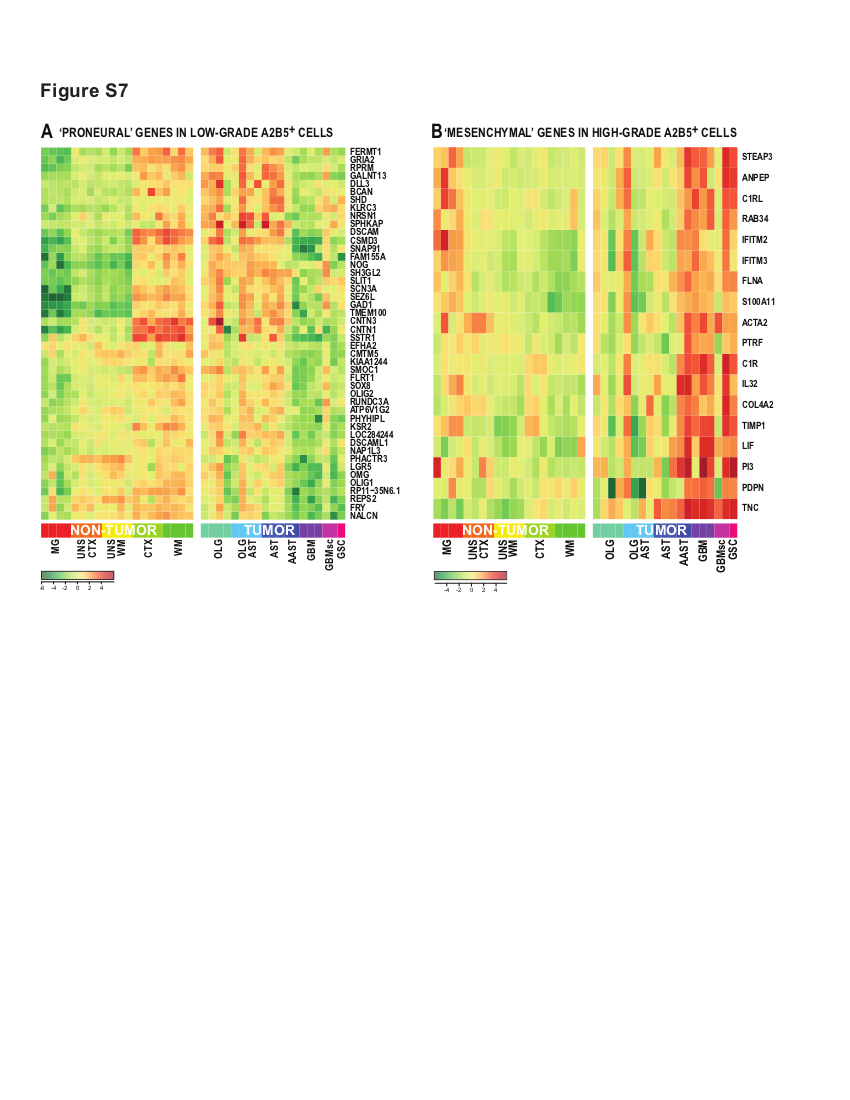
| Figure S7 (related to Figure 5): Enrichment of the proneural and the mesenchymal signature in, respectively, low-grade and high-grade derived A2B5+ glioma cells |
|---|
| (A) Heat map representation of Gene set enrichment analysis (GSEA), performed using the 233-gene ‘proneural’ gene set of Phillips and colleagues (Phillips et al., 2006), showed a significant enrichment of proneural genes enriched in A2B5+ cells isolated from low-grade glioma. (B) Heat map representation of Gene set enrichment analysis (GSEA), performed using the 132-gene ‘Epithelial-Mesenchymal transition’ (EMT) gene set of Phillips and colleagues (Phillips et al., 2006), identified a significant number of EMT genes enriched in HG-derived A2B5+ cells relative to their LG counterparts. LG: Low-grade; HG: High-grade; MG: microglia; UNS CTX: unsorted cortical cells; UNS WM: unsorted white matter cells; CTX: A2B5+ cells from normal cortex; WM: A2B5+ cells from normal white matter; AST: Astrocytoma; AAST: anaplastic astrocytoma; OLG: Oligodendroglioma; OLG-AST: Oligo-astrocytoma; GBM: Glioblastoma; GBM sc: small cell GBM; GSC, gliosarcoma; |
 View PNG |
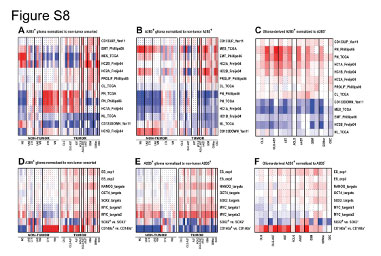
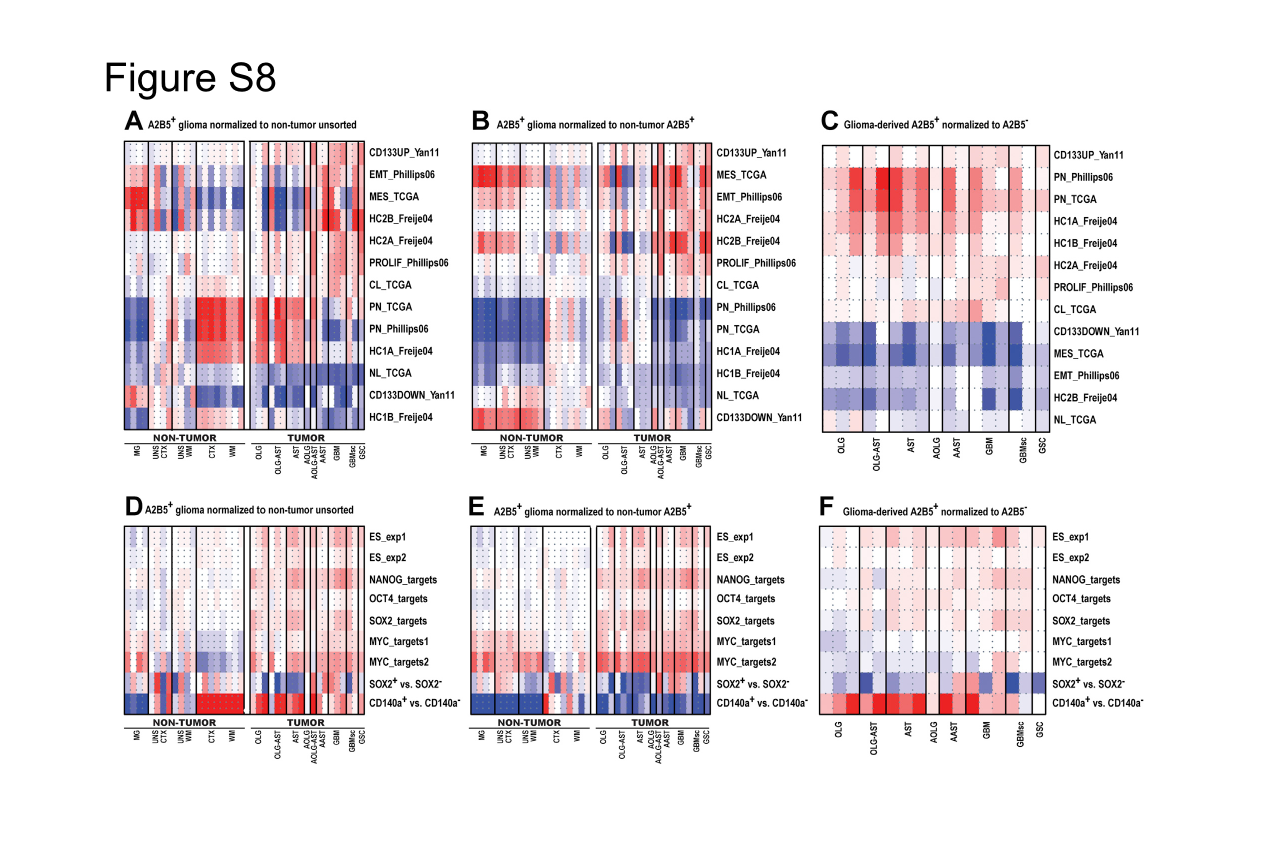
| Figure S8 Resemblance of the A2B5 Signature to Glioma and Neural Precursor Cells Compendium Studies, Related to Figure 5 |
|---|
| Heat-map representation of enrichment patterns of the A2B5 signatures across previously established gene expression profiles related to human gliomas, glioma stem cells (A-C), embryonic stem cells (ESCs) and neural precursor cells (NPCs) (D-F) using parametric gene set enrichment (PGSEA) analysis. (A and D) PGSEA analysis was performed and PAGE Z scores were calculated following normalization of the gene expression data to the median of non-tumor unsorted cells extracted from adult human white matter and cortex. The color scale ranges from red to blue indicating positive and negative z scores respectively (in A range of 16.1 to ?16.1 scores, D, ± 15). (B and E) PGSEA analysis and Z scores following normalization to non-tumor A2B5+GPCs extracted from adult human white matter and cortex (range: B, ± 19.3, E, ± 15). (C and F) PGSEA analysis was performed on expression ratios of individually normalized A2B5+glioma cells compared to their matched A2B5- sorted cells control (range: C, ± 24.3, F, ± 20.2). UNS CTX: unsorted cortical cells; UNS; WM: unsorted white matter cells; CTX: A2B5+ cells from normal cortex; WM: A2B5+ cells from normal white matter; AST: Astrocytoma; AAST: anaplastic astrocytoma; OLG: Oligodendroglioma; OLG-AST: Oligo-astrocytoma; GBM: Glioblastoma; GBM sc: small cell GBM; GSC, gliosarcoma. |
 View PNG |
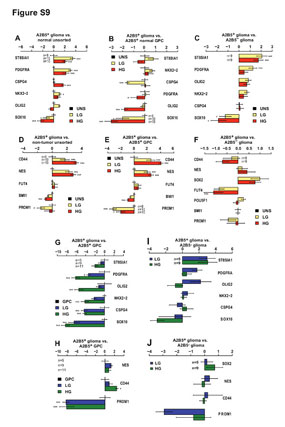
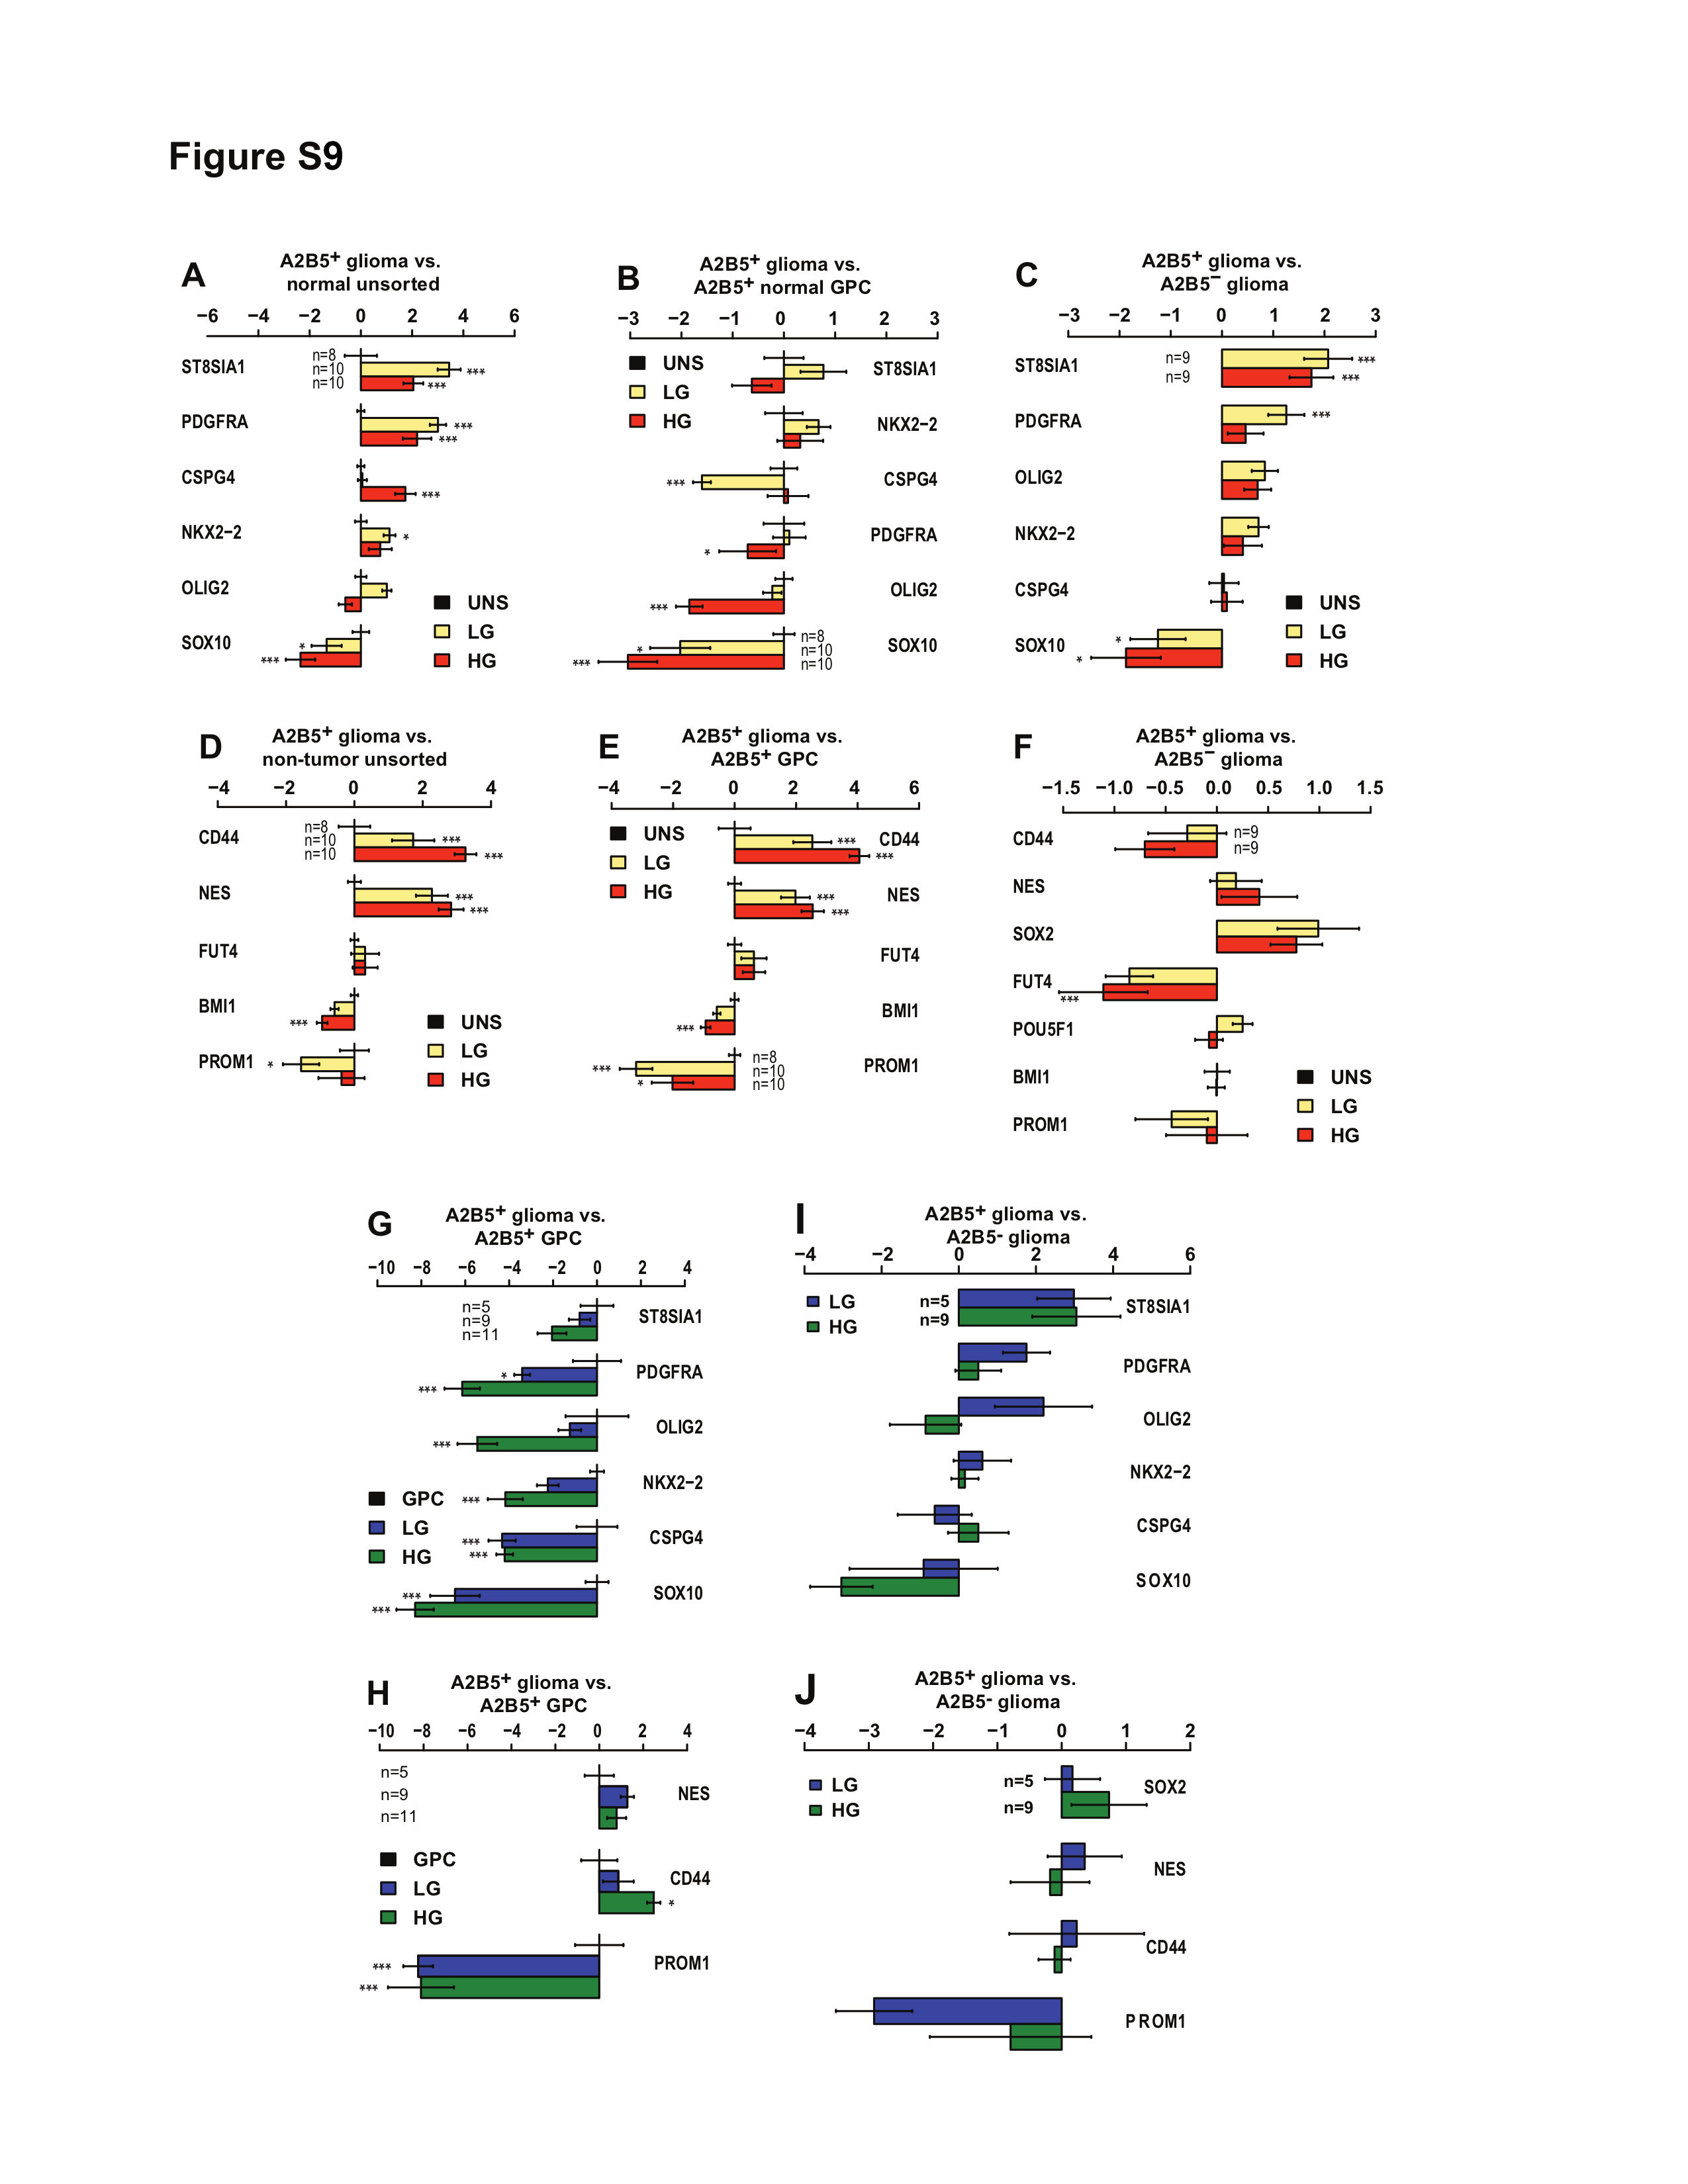
| Figure S9 (related to Figure 5): Marker gene expression profiles of glioma-derived A2B5+ cells |
|---|
| Microarray (A-F) and real-time (RT) PCR validation (G-J) of specific GPC and NSC markers gene expression by glioma-derived A2B5+ cells. Mean expression levels were calculated following normalization against GAPDH and presented as mean ± SEM. Statistically significant regulation was determined separately using a linear model and is indicated as follows: * q<0.05, ** q<0.01, *** q<0.001. (A-D) Bar plot of specific GPC (A- C) and NSC (D-F) marker gene expression levels in glioma-derived A2B5+ cells compared to non-tumor unsorted cells (A,D), non-tumor A2B5+ cells (B,E) and glioma- derived A2B5- cells (C,F). (G-J) Bar graph of GPC (G,I) and NSC (H,J) marker gene expression by A2B5+ glioma ells relative to non-tumor A2B5+ cells (G,H) and A2B5- glioma cells GPC: glial progenitor cell; NSC: neural stem cell. |
 View PNG |
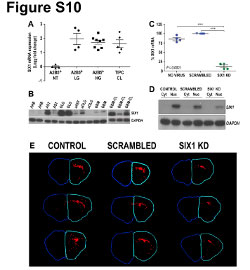
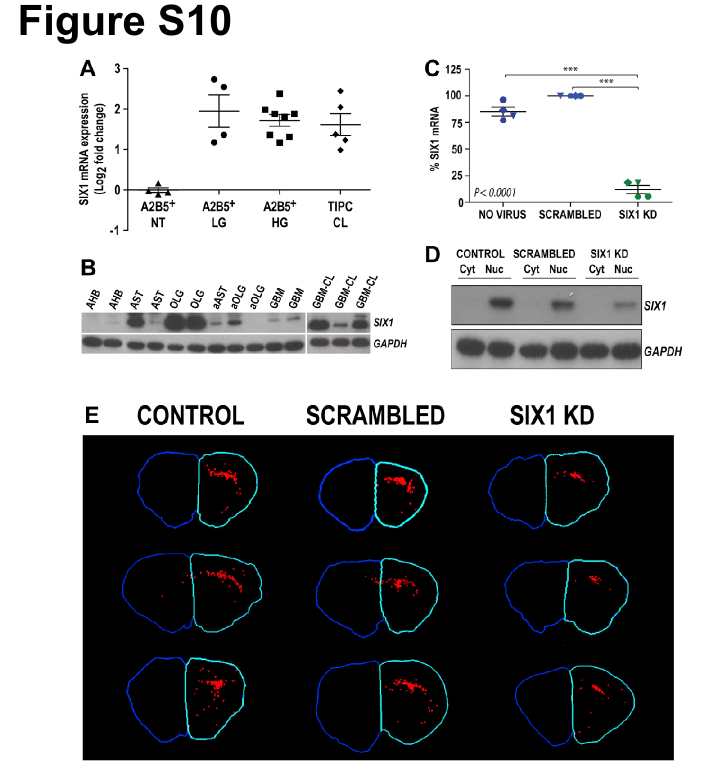
| Figure S10 (related to Figure 7): Expression of CD24 into the fetal and the adult human brain |
|---|
| Immunohistochemical illustration of CD24 expression (red) in fetal (18 gestational week) and adult human brain. Nuclei were counterstained using DAPI (blue). CD24 was strongly and diffusely expressed in the fetal human brain, from the cortical plate (CP), through the intermediate zone (IZ), to the ventricular (VZ) and the sub-ventricular zone (SVZ). In the adult human brain, CD24 expression appears to be restricted to the ependymal layer (EL) with a diffuse pattern observed in the sub-ependymal layer (SEL). No expression of CD24 was observed in the white matter or the cortex. Ct: control staining (omission of the primary antibody). |
 View PNG |