URMC / Labs / Zhong Lab / Projects / Quantitative Imaging Methods
Quantitative Imaging Methods
In the work of Zhu et al (2008, 2009, 2011), we assessed the feasibility of multi-center DTI studies by direct quantification of accuracy and precision of each dataset. Accuracy was quantified via comparison to carefully constructed gold standard datasets while precision (the within-scan variability) was estimated by wild bootstrap analysis. The results from both the phantom and human data suggest that the inter-site variation in system performance, although relatively small among scanners of the same vendor, significantly affects DTI measurement accuracy and precision and therefore the effectiveness for the integration of multi-center DTI measurements. Our results also highlight the value of a DTI-specific phantom in identifying and quantifying measurement errors due to site-dependent variations in the system performance, and its usefulness for quality assurance/quality control in multi-center DTI studies.
Pictured Right (top): A typical WB analysis includes three steps. Step 1: Data acquisition and initial tensor fitting. Here, the weighted least square fitting is used for obtaining the initial diffusion tensor dˆ and the fitting residuals eWLS. Step 2: Wild bootstrap samples generation. In this step, the fitting residuals eWLS are scaled by the selected HCCME function, T(•), before multiplying with the random samples from a Rademacher distribution function, f , to generate the bootstrap resamples of the fitting residuals e(=T(•) • eWLS• f ) with the sample number to be NWBS. The wild bootstrap samples of DTI datasets are formulated using the initial tensor estimation dˆ and bootstrap samples of e and will further generate the wild bootstrap samples of tensor d^ as well as the tensor derived parameters FA, MD, CU. Step 3: Wild bootstrap statistics formulation. Measurement uncertainties associated with the DTI- derived parameters are quantified as the standard deviation values from the pool of the wild bootstrap samples of those parameters.
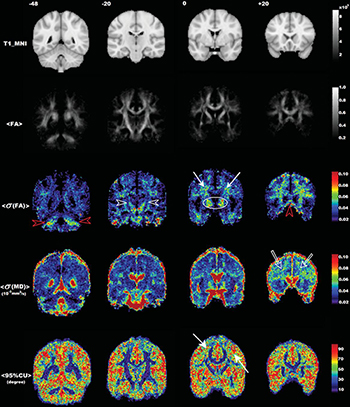
Pictured Right (bottom): Regional distributions of DTI measurement uncertainties in healthy human brain with WB estimates. The _ (FA) (row 3), _ (MD) (row 4), and _95% CU_ (row 5) maps are presented together with the anatomical T1 template (MNI152 T1) in row 1, the averaged FA (row 2) over all subjects for reference of spatial and structural locations. Talairach y-coordinates of slice locations are labeled on the top. Comparisons between the MNI152 T1 template (row 1) and the normalized FA (row 2) suggest the effectiveness of our spatial normalization procedure, with an overall good match not only at the edge of brain but also for most WM structures. In general, most of the WM regions, such as the cortical spinal tract marked by white arrowheads, have overall good measurement precision indicated by the blue color in all three types of uncertainty maps. In addition, several localized increases of measurement uncertainties are marked as examples of regions where measurement precision may be affected by different sources of variation beyond thermal noise.
« back to all projects