Service Analysis
The GRC performs a variety of services that generates millions of NGS data points everyday. The Bioinformatics group has worked hard to develop and maintain standard processing pipelines to reproducibly analyze bulk RNA-Seq, single cell RNA-Seq, ChIP/ATAC-Seq, and WGS/WES. These pipelines generate results that we refer to as our 'preliminary analysis' that get delivered to the investigator upon the completion of an NGS experiment.
Our deliveries are delivered directly to smdnas02 drives for URMC PIs or sent over email and provide three links to download:
(1) raw FASTQ data
(2) alignment data in BAM/BAI format
(3) multiQC report showing QC and general statistics
(4) analysis results, which will change depending on the experiment.
Below you will see all service analyses that we provide and more details about the specific results that are delivered for each.
Reference Genomes and Annotations
We are currently using the following reference genome (primary assembly) builds and their associated annotation versions. Our standard annotations are sourced from Ensembl, which integrates the comprehensive GENCODE annotations. Please let us know if you need your data processed with a specific genome build or annotation version before submitting your experiment.
- Human: GRCh38, using Ensembl release 115 (which incorporates GENCODE v49).
- Mouse: GRCm39, using Ensembl release 115 (which incorporates GENCODE M33).
Please note that older versions are available upon request during sample submission.
Bulk RNA-Seq
Sequencing design = 2 x 150 bp
*Paired-end sequencing of 150 bp is not required for mRNA approaches but is utilized by the GRC to efficiently fill shared NovaSeq X PLUS flow cells.
Sequencing platform = NextSeq2000/NovaSeq X PLUS
Standard Analysis Package Includes:
(1) Aligned data files (bam files)
(2) Raw data files (fastq files)
(3) MultiQC HTML Report
(4) Two HTML sequencing Reports generated using Salmon, one for gene-level quantification and one for transcript-level quantification. Each of these reports include:
- PCA Plot
- Sample Distance Heatmap
- Differential Expression Results for compared groups (e.g Mutant vs WT)
-- Differential Expression Summary: Basemean, log2Fold Change, Stat, p-value, p-adjusted value
-- Volcano Plot
-- MA Plot
-- Enrichr results (StarFeature Counts only)
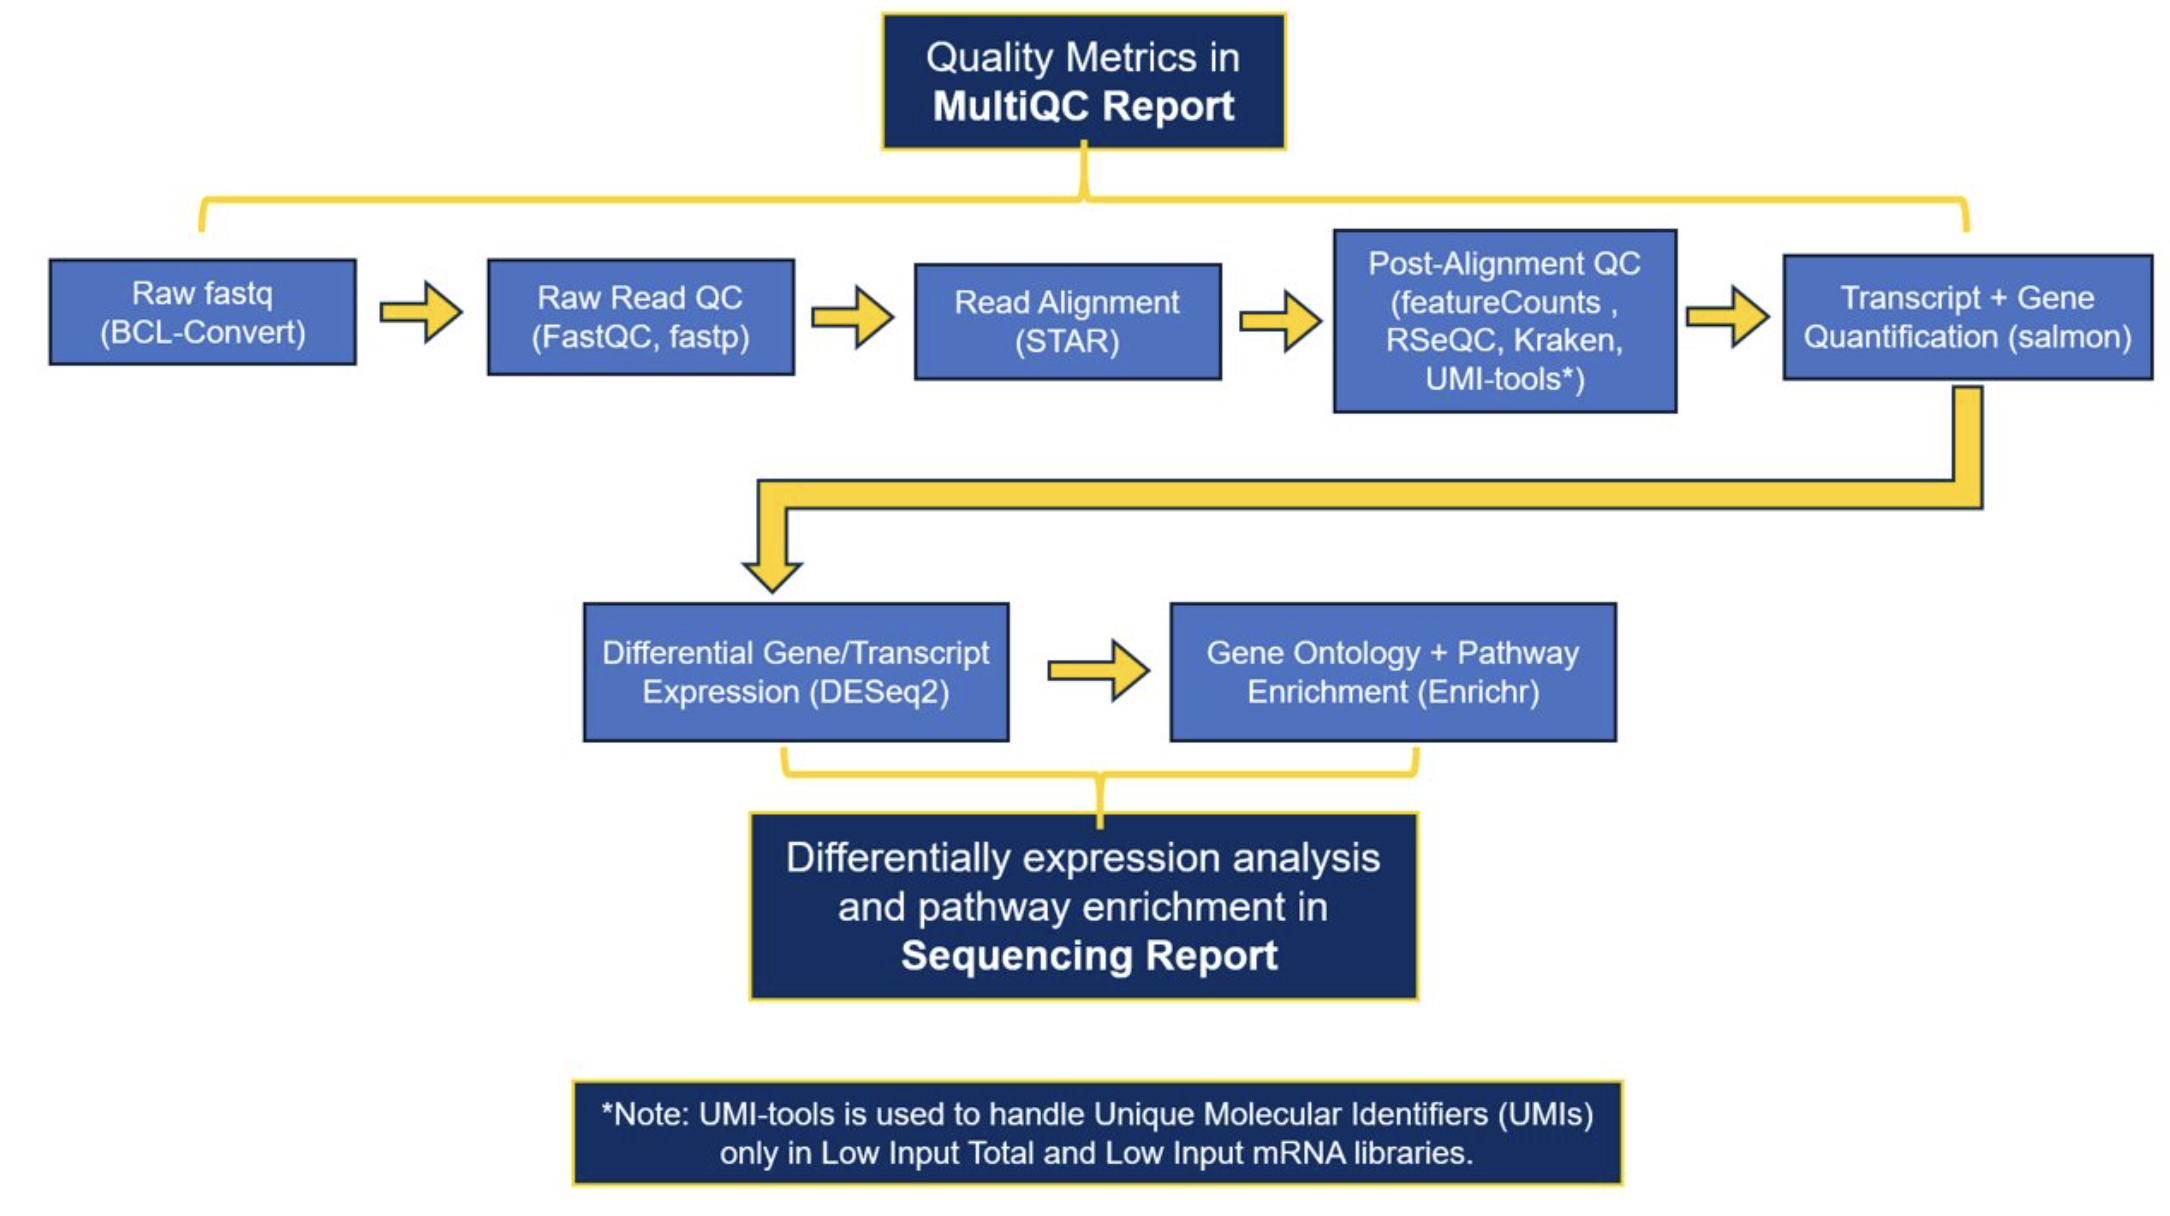
The current software that we use to generate our preliminary results: FastQC, fastp, STAR, multiqc, RSeQC, Kraken, Salmon, DESeq2, enrichr
A full list of the software and versions that were used in processing each project can be found in the MultiQC report.
As of early March 2026, the GRC’s standard bulk RNA-Seq analysis is performed using the nf-core RNA-seq pipeline. Nf-core is a community-developed initiative that provides version-controlled, peer-reviewed, and standardized workflows that implement current best practices. Implementing this nf-core workflow means that we have transitioned from our previous pipeline in an effort to improve standardization and reproducibility. As a result, deliverables from projects processed after March 2026 may differ slightly from prior deliveries. While the majority of our workflow and the software used is unchanged, the main update is that Salmon is now used to quantify both transcript-level abundance and gene-level abundance of counts, where gene-level abundance was previously calculated using featureCounts. The delivered reports contain excellent detail about our data workflows, but please contact us(nf-core updates) if you would like additional details about the workflow or methodological differences.
Download Example RNA-Seq Reports:
Sequencing Report Example MultiQC Report Example
*Once you select the link, you will be directed to Box. Please download them from Box to view and interact with the reports.
Click here for our Protocols.io page for more information on Bulk RNAseq analysis at the GRC.
10X Genomics Single Cell RNA-Seq
Sequencing paradigm = Custom Paired-End sequencing
Sequencing platform = target 50-100k reads/cell (# cells captured may change platform selection)
Standard Analysis Package includes standard output of cellRanger software:
(1) Sample Web Summaries
(2) Counts data
(3) Raw data (fastq files)
The counts data can then be easily read into other downstream analytical tools like Loupe Browser and Seurat .
Example Web Summary Report: 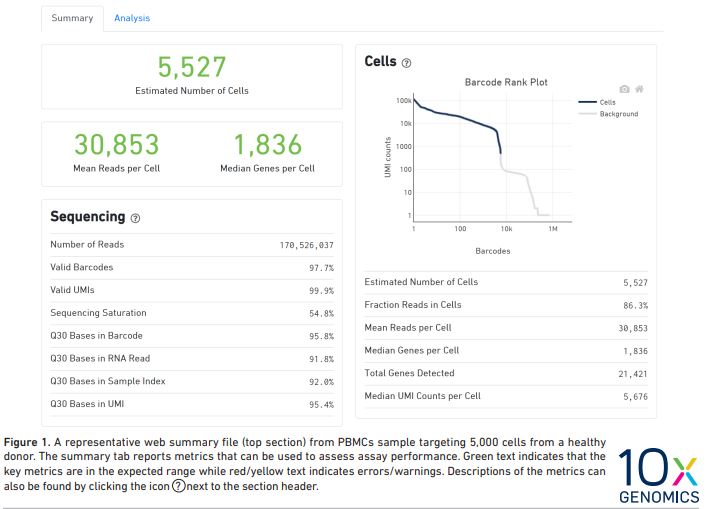
10X Genomics Web Summary Report Interpretation Document
10X Genomics Visium HD Spatial Transcriptomics
Visium data (VisiumHD, VisiumHD 3’) will be processed with the 10X SpaceRanger software before delivery. The standard analysis package includes:
- Space Ranger web summary reports (example web summary report linked here: Sample_50162259_D0_1_VisiumHD_web_summary.html)
- Space Ranger counts
- Raw data files (fastq files)
- BigTiff image files
For additional details on the file output structure from SpaceRanger, please visit the 10X Genomics Support website.
We recommend that you use the Loupe Browser application to get started with exploring your Visium data. The GRC Informatics team has written a protocol that details how to access Loupe Browser. Additionally, we provide a walkthrough of how to leverage Loupe Browser to explore your data.
As part of our spatial transcriptomics workshop series that began in 2025, the GRC Informatics team generated extensive resources on how to work with spatial transcriptomic data, including Visium.
For users with a UR or URMC login, you can access these resources on our GRC Blackboard (password = GenomicsWorkshop).
If you are not a UR/URMC member, please contact us and we will be happy to share these resources!
If you need help with custom analyses for your Visium data, the GRC Informatics team is happy to help. Please reach out at URGenomics@urmc.rochester.edu to request assistance.
10X Genomics Xenium Spatial
The Xenium instrument processes data in parallel with imaging and biochemistry cycles, which allows users to start exploring and interpreting their data as soon as the data is delivered. Investigators will receive their Xenium results organized as a folder of bundled output files per sample. More detailed information on these files can be found on the 10X Genomics Support website.
To start, we recommend you open the 'analysis_summary.html' file in your browser, which is included in the delivery folder for each sample. This file includes a summary of key QC metrics, along with metrics of decoding, cell segmentation, analysis, and image QC. You can find an example analysis_summary.html file here. GRC_Compass_Xenium_5K_D0-1_analysis_summary.html
We highly recommend that you use the Xenium Explorer application to get started with investigating your Xenium data, and detail resources to help you get started below.
Xenium Data Resources
- For URMC users, the Xenium data will be delivered to your smdnas02 folder. You can visualize the data directly from this folder using the Xenium Explorer app on Momentum. We will work with external users to deliver data via appropriate methods, and for those users the Xenium Explorer application can be downloaded from the 10X Genomics website. You can find a protocol that details how to access Xenium Explorer both on Momentum and on your local computer.
- The GRC Informatics team has generated a walkthrough of how to leverage Xenium Explorer to explore your data.
- As part of our 2025 spatial transcriptomics workshop series, the GRC Informatics team has generated extensive resources on how to analyze spatial transcriptomic data, including Xenium. For users with a UR or URMC login, you can access these resources on our GRC Blackboard (password = GenomicsWorkshop).
If you are not a UR/URMC member, please contact us and we will be happy to share these resources!
If you need help with custom analyses for your Xenium data, the GRC Informatics team is happy to help. Please reach out at URGenomics@urmc.rochester.edu to request assistance.
ChIP/ATAC-Seq
Sequencing design = ChIP-Seq: 1x100; ATAC-Seq: 2x75
Sequencing platform = NextSeq2000/NovaSeq 6000/NovaSeq X
This pipeline is designed to work with data generated for ChIP-Seq and ATAC-Seq experiments.
Standard Analysis Package Includes:
(1) Continuous coverage data in the bigwig and bedgraph format
(2) Enrichments in the narrowPeak, broadPeak, or BED format
We can also discuss analysis plans for downstream motif enrichment, differential binding, nucelosomal positioning, and nearest gene annotation in a consulting meeting since these types of analyses tend to change based on the underlying hypothesis.
The current software that we use to generate our preliminary results: fastp, bowtie2, deeptools alignment sieve, samtools, bamqc, picardtools, macs2 (with project specific parameters).
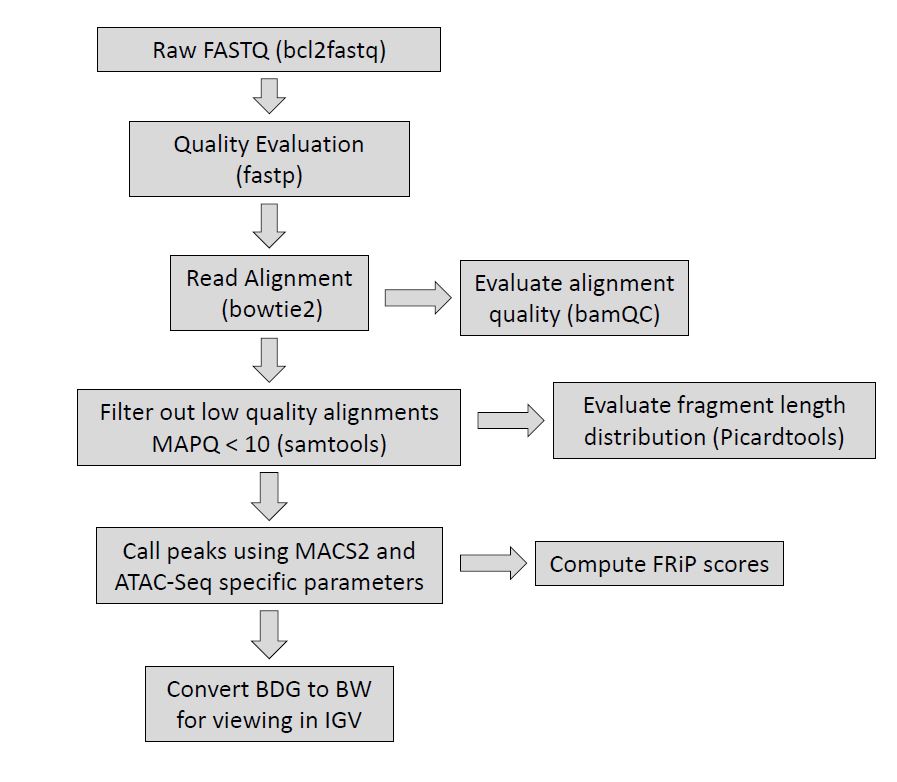
Figure 2. Overview of the Epigenetics Pipeline specifically for ATAC-Seq, indicating what tools are used at each step. Please note, the fragment length distribution computed by picardtools will also only be computed for paired-end approaches.
Small RNA
Sequencing design = 2x150 bp
*Paired-end sequencing of 150 bp is not required for smRNA approaches but is utilized by the GRC to efficiently fill shared NovaSeq X Plus flow cells.
Sequencing platform = NovaSeq X Plus (assuming Unique Dual Index configuration is used)
Standard Analysis Package Includes:
1. Raw data files (fastq files)
2. Aligned data files (bam files)
3. MultiQC Report (html file)
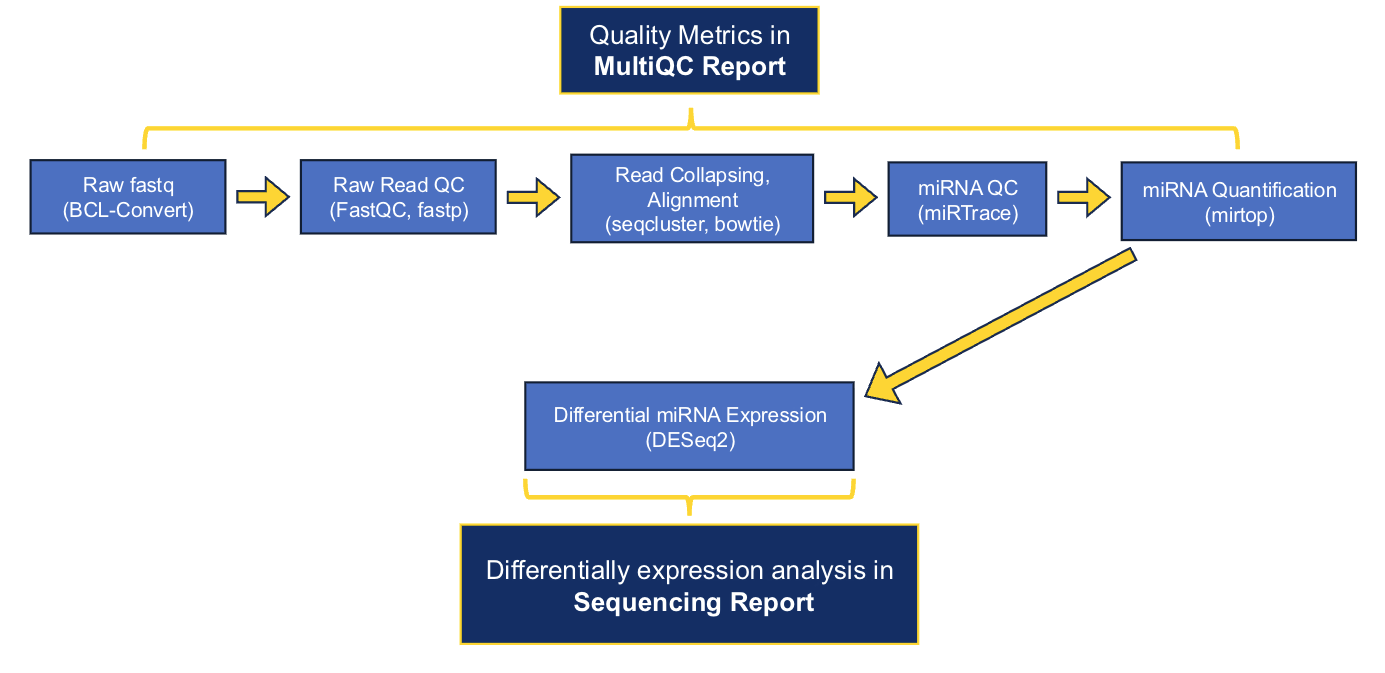
4. Sequencing report (html file) with differential expression results for mature miRNA reads. The sequencing report includes:
- PCA Plot
- Sample distance heatmap
- Differential expression results for compared groups (e.g. Mutant vs WT)
- Differential expression summary (BaseMean, log2Fold Change, stat, p-value, p-adjusted value)
- Heatmap
- Volcano Plot
- MA plot
The main software that we use to generate preliminary results are as follows: fastp, seqcluster, bowtie, miRbase, mirtop, and DESeq2. A full list of the software and versions that were used in processing each project can be found in the delivered MultiQC and sequencing reports.
As of early July 2026, the GRC's standard small RNA-Seq analysis is performed using the nf-core smRNA-seq pipeline. Nf-core is a community-developed initiative that provides version-controlled, peer-reviewed, and standardized workflows that implement current best practices. Implementing this nf-core workflow means that we have transitioned from our previous pipeline in an effort to improve standardization and reproducibility. As a result, deliverables from projects processed after July 2026 may differ slightly from previous deliveries. The delivered reports contain detail about our data workflows, but please contact us if you would like additional details.
Download Example smRNA-Seq Reports:
Sequencing Report Example MultiQC Report Example
*Once you select the link, you will be directed to Box. Please download them from Box to view and interact with the reports.
Microbiome
16S rRNA
Sequencing design= 2x300 (V3-V4 & V1-V3); 2x150 (V4)
Sequencing platform = MiSeq/NextSeq 2000
16S rRNA hypervariable regions V1-V3 or V3-V4. Primary processing using QIIME 2 including primer removal and end trimming. Forward and reverse read merging, chimera removal, quality filtering, and denoising with DADA2. Taxonomic classification with target region-specific naive Bayesian classifier trained on the GreenGenes or SLIVA reference databases.
Standard Analysis Package Includes:
(1) Sequences of amplicon variants
(2) Taxonomic assignments to sequence variants
(3) Associated counts.
These can be generated at various taxonomic resolutions (e.g. species, genus, etc.)
Shotgun Metagenomics or Metatranscriptomics
Sequencing Platform = please inquire. Will vary based on sample number and type.
Reads are preprocessed to remove Illumina adapters, low quality bases, and host/rRNA contaminants. Taxonomic and function profiling can be performed using read-based and/or assembly-based methods. Our read-based workflow uses Metaphlan and Humman from the BioBakery suite of tools developed by the Huttenhower lab. This approach maps reads to a taxonomic and functional marker gene database and is a relatively fast way to profile communities with relevant reference genomes, primarily the human gut microbiome. Our assembly-based workflow performs de-novo assembly of reads into contigs and groups contigs into bins based on sequence similarity. These bins are then given a taxonomic assignment based on homology to the NCBI nt database. Genes are called within these bins and then assigned functions from multiple protein and metabolic databases like PFAM and KEGG. The assembly-based workflow into for is ideal for non-human samples or projects seeking strain level resolution for phylogenetics and comparative genomics.
Standard Analysis Package Includes:
(1) Tables of taxonomic, gene, and metabolic pathway abundance
(2) Sequences for all assembled contigs/bins
(3) Metrics from strain level genome comparisons (SNPs and SNP linkage, contig coverage, and contig homology)
Whole Genome & Whole Exome Sequencing (WGS/WES)
Sequencing design= 2x150
Sequencing platform = NovaSeq 6000/NovaSeq X
The GATK best practices pipeline is used to align WGS and WES data to the human reference genome (GRCh38/hg38), call SNPs and INDELs, filter variants to reduce false positives, and annotate with known information about each loci and potential functional consequences. Results deliverables include: all variant calls with annotations in VCF format.
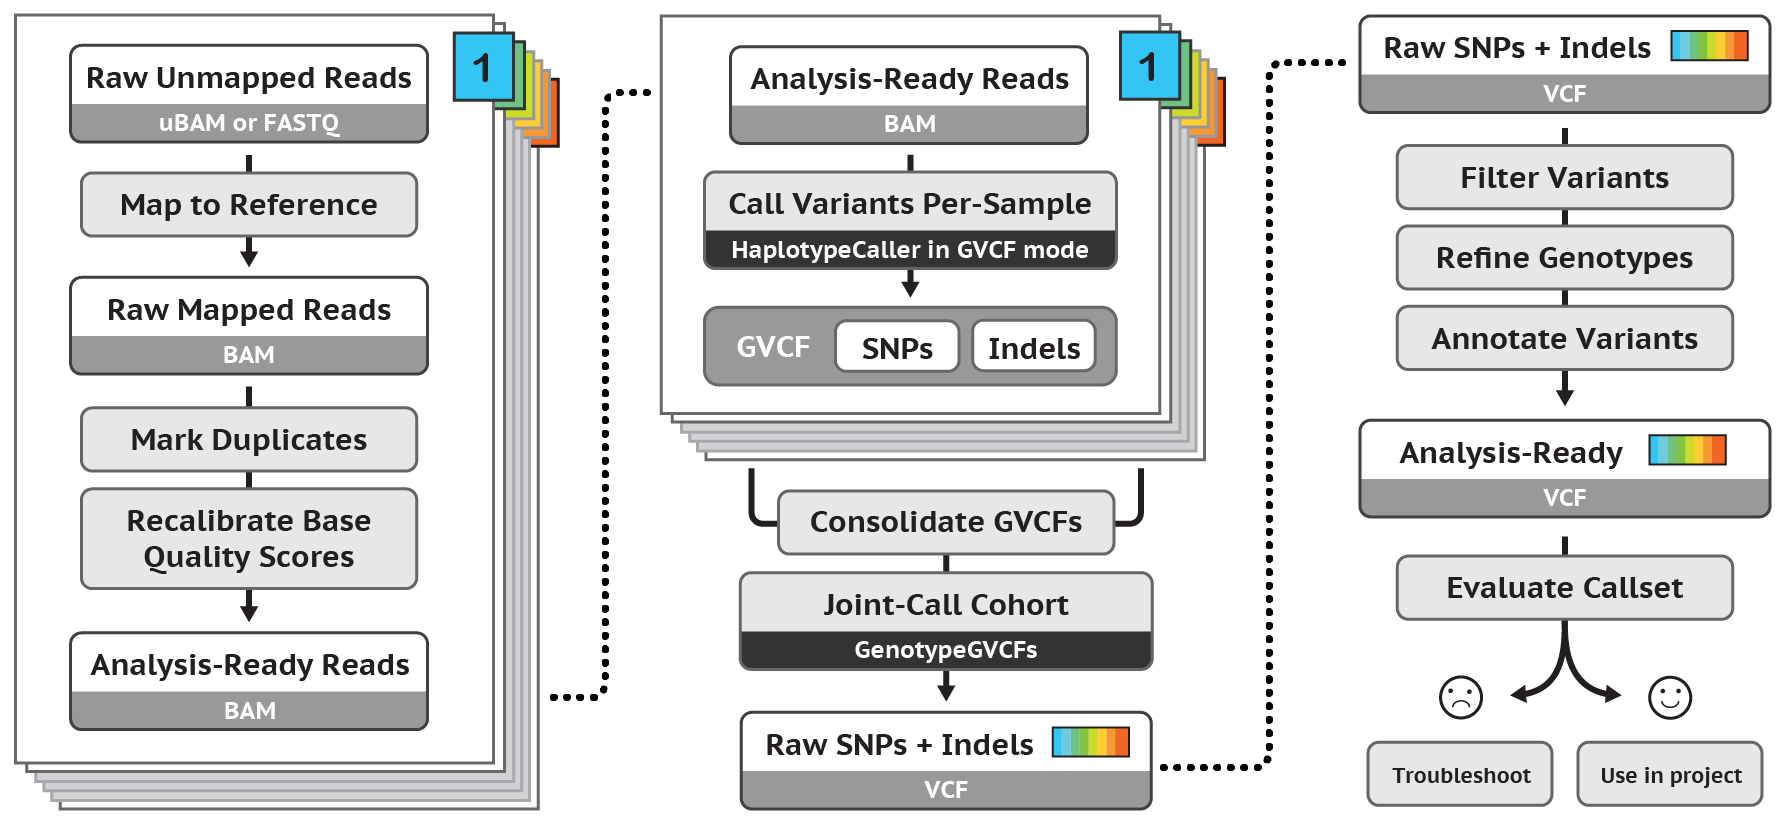
Figure 3. Overview of GATK pipeline reference: https://software.broadinstitute.org/gatk/