Quality Assessments

The Genomics Research Center users several assays for the quantification and quality assessment of submitted samples. Below is an outline of typical QC performed based on sample type:
| Concentration | Quality Assessment | |
|---|---|---|
| RNA | Nanodrop | Bioanalyzer Fragment Analyzer |
| DNA and cDNA | Qubit | Bioanalyzer Fragment Analyzer |
| PCR Amplicons NGS Libraries | Qubit | Bioanalyzer Fragment Analyzer Tapestation |
*The GRC will determine the most appropriate assays for your samples based on several factors such as sample number, volume, expected concentration, previous submissions, sample queue, etc.
Nanodrop One
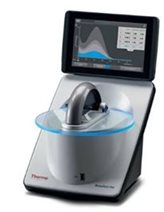 Used to measure concentration and purity of nucleic acids. The concentration (ng/uL) is based on the absorbance of nucleic acids at 260 nm. Two ratios are measured to assess purity:
260/280 ratio: "Pure" DNA samples have a ratio of ~1.8. "Pure" RNA samples have a ratio of ~2.0. If this ratio is lower, it could indicate protein contamination, phenol presence, or other contaminants that absorb at 280 nm.
260/230 ratio: This ratio should be between 1.8 and 2.2. If lower, it could indicate the presence of co-purified contaminants.
RNA Range: 10 - 2,500 ng/uL
*Nanodrop values are sensitive to contaminants and do not indicate quality of RNA samples. Other assays (such as bioanalyzer) should be used to assess the quality of RNA.
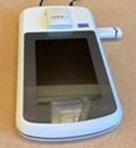
Nanodrop Eight

Used to measure concentration and purity of nucleic acids. The concentration (ng/uL) is based on the absorbance of nucleic acids at 260 nm. Two ratios are measured to assess purity:
260/280 ratio: "Pure" DNA samples have a ratio of ~1.8. "Pure" RNA samples have a ratio of ~2.0. If this ratio is lower, it could indicate protein contamination, phenol presence, or other contaminants that absorb at 280 nm.
260/230 ratio: This ratio should be between 1.8 and 2.2. If lower, it could indicate the presence of co-purified contaminants.
RNA Range: 10 - 2,500 ng/uL. This particular instrument allows for the interrogation of up to 8 samples at once with use of a multichannel pipette.
*Nanodrop values are sensitive to contaminants and do not indicate quality of RNA samples. Other assays (such as bioanalyzer) should be used to assess the quality of RNA.
Invitrogen Qubit Fluorometer 3.0
 Used to measure concentration of DNA, RNA, and Protein. The flexibility of the system allows for 1 - 20 uL of sample and the selective dyes specific for dsDNA and RNA minimize the effects of contaminants.
dsDNA Range: 1 to 500 ng/mL
RNA HS Range: 25 to 500 ng/mL
Qubit Flex
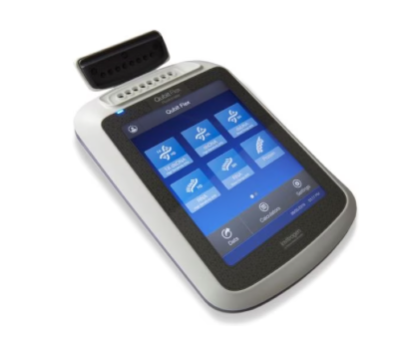 Used to measure concentration of DNA, RNA, and Protein. The flexibility of the system allows for 1 - 20 uL of sample and the selective dyes specific for dsDNA and RNA minimize the effects of contaminants. Allows for running 8 samples at once in a strip tube.
dsDNA Range: 1 to 500 ng/mL
RNA HS Range: 25 to 500 ng/mL
Agilent Bioanalyzer
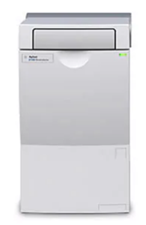 Automated microfludics system used for quality assessment of RNA and DNA samples.
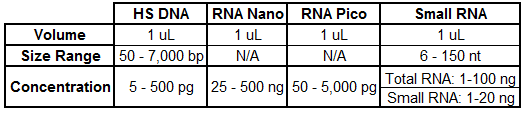
HS = High Sensitivity
Agilent Fragment Analyzer
 Capillary electrophoresis for quality assessment of RNA and DNA samples.
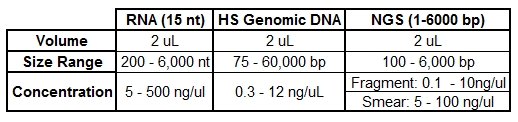
HS = High Sensitivity NGS = Next Generation Sequencing (Libraries)
Agilent Tapestation 4200
 Electrophoresis separation of RNA and DNA Samples.
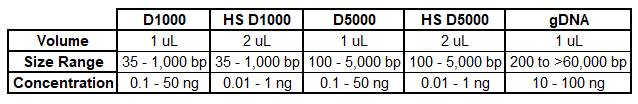
HS = High Sensitivity
Aggregate Reports from the GRC
After QC is complete, you will receive an Aggregate Report summarizing the QC assays performed.
Example RNA Aggregate Report:

Sample Name: Sample name indicated on sample submission sheet
Sample ID: a unique identifier assigned to samples upon submisison
Conc. Source (RNA): The assay that was used to generate the Concentration (ng/uL) field
RIN Source: The assay used to generate the trace images and RIN values
Trace Image: To expand the trace image, right-click the image and open in a new tab
Example DNA Aggregate Report:
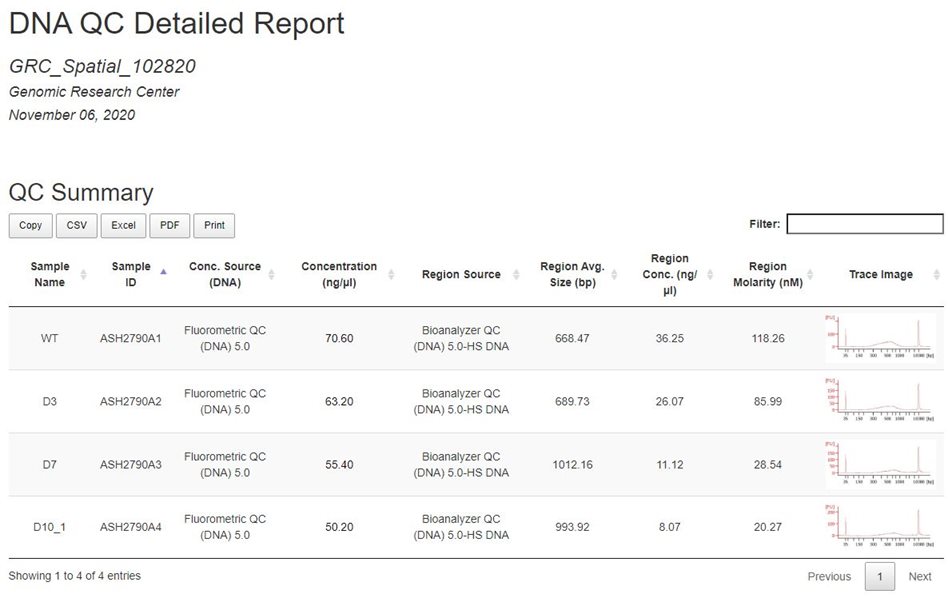
Sample ID: a unique identifier assigned to samples upon submisison
Conc. Source (DNA): The assay that was used to generate the Concentration (ng/uL) field
Region Source: The assay used to generate Region Average Size, Region Concentration, Region Molarity, and Trace Images
Trace Image: To expand the trace image, right-click the image and open in a new tab
Example Library Aggregate Report:
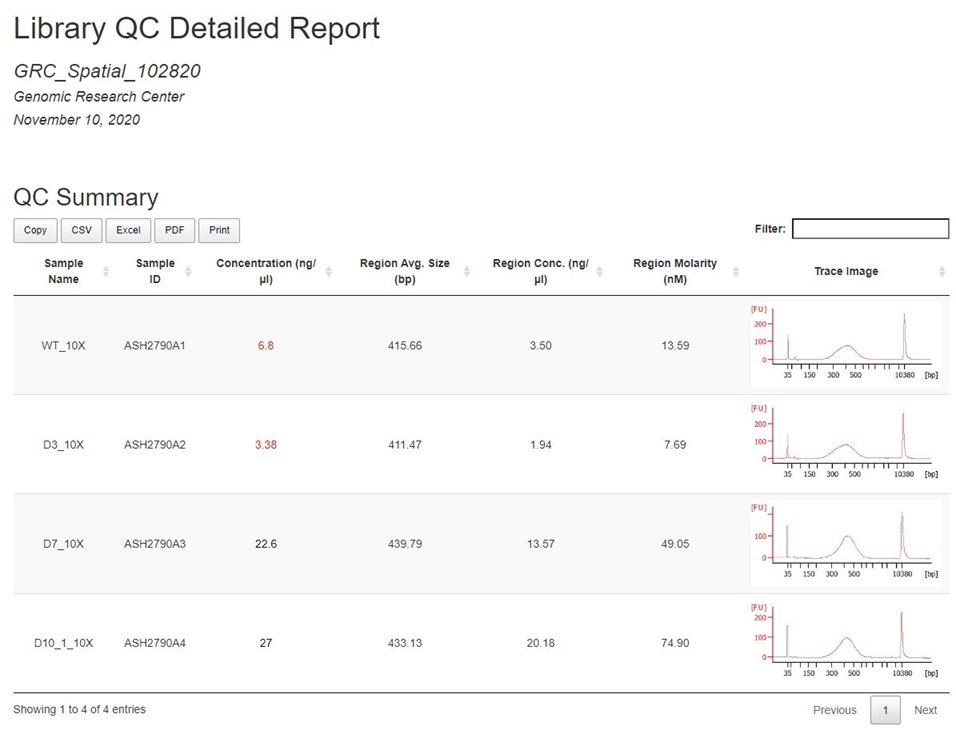
Sample ID: a unique identifier assigned to samples upon submisison
Trace Image: To expand the trace image, right-click the image and open in a new tab